Zydus Lifesciences Ltd. (formerly known as Cadila Healthcare Ltd.) is one of India’s leading pharmaceutical companies, known for its diverse portfolio in both generics and specialty medications. Established in 1952, Zydus has a strong presence across multiple therapeutic areas, including cardiovascular, gastroenterology, pain management, diabetes, oncology, and dermatology. The company is also a significant player in bio similar, vaccines, and novel therapies, catering to both domestic and international markets. Operates across 50+ countries, with a significant focus on the U.S. and Indian markets. It is among top 5 pharmaceutical companies in India, with a share of around 4-5% in the Indian pharma market. It operates 25+ manufacturing facilities worldwide, including U.S. FDA and WHO-GMP certified plants, ensuring compliance with international quality standards.
Industry Outlook
The Indian pharmaceutical industry is one of the largest globally, with India positioned as a major supplier of generic medicines worldwide. The industry, valued at approximately $50 billion in 2023, is expected to grow at a compound annual growth rate (CAGR) of around 10-12%, driven by increasing healthcare needs domestically and sustained demand for affordable generics in international markets. Healthcare expenditure is increasing, with the government aiming to raise public health spending to 2.5% of GDP by 2025, which will benefit the pharma sector. India is the largest provider of generic medicines, supplying around 20% of global generics. With over 3,000 pharma companies and 10,000+ manufacturing facilities, India continues to dominate in terms of affordable drug exports, particularly to the U.S., Europe, and other emerging markets. The Government of India has introduced the Production Linked Incentive (PLI) scheme. Increased competition from both Indian and global players is intensifying in generic and speciality segments. Mergers and acquisitions are common as companies seek to scale and expand product portfolios.
Financial Summary
INR Cr.
Q1 FY25
Q2 FY25
FY23
FY24
Revenue
6208
5237
17237
19547
EBITDA
2084
1461
3860
5384
OPM
34%
28%
22%
28%
PBT
1900
1271
2585
4832
Net Profit
1482
920
2092
3973
NPM
23.9%
17.5%
12.1%
20.3%
EPS
14.11
9.06
19.37
38.36
C&CE
1238
1594
573
1105
Business Segments:
India Formulations: It is a branded prescription business in categories of therapies like Pain, Anti-infective, Respiratory, Oncology, and many other segments. It has 7 brands which were ranked among world’s top 300 brands. 37 brands had value between ₹25-₹50 crore, 21 brands between ₹50-₹100 crore and 10 were having yearly ₹100+ crore.
Consumer Wellness: The Company has many successful brands in the consumer wellness segment like Glucon-D, nycil, Sugar-Free, Complan, etc. And a skincare brand called Everyuth naturals. It is in category of personal care and food and nutrition and has recently acquired Naturell Pvt Ltd. A leading player in the healthy snack category.
US Formulations: The company predominantly operates in the generics and specialty segments of the market through its wholly-owned subsidiary, Zydus Pharmaceuticals USA Inc. In this quarter company had filed 8 ANDA and received approvals of 9 ANDAs. It has entered into an exclusive licensing and supply agreement with Viwit Pharmaceuticals for 2 Gadolinium-based Magnetic Resonance Imaging (MRI) injectable, contrast agents.
International Market Formulations: In the emerging markets space, the Company predominantly operates in the branded generics segment with Cardiology, Diabetology, Neuro-Psychiatry and Pain Management being the focused therapeutic areas. The Company keeps on evaluating partnership opportunities with local players in select geographies as it looks to expand its footprint in different emerging market countries
Subsidiary Information:
Zydus Wellness Ltd: The Company’s subsidiary spearheads the group’s operations in the wellness space. ZWL operates in two different segments viz. personal care segment and food and nutrition segment and has a portfolio of category-leading health and wellness products. Five out of the six brands of the Company continue to hold leadership positions in their respective categories
Zydus Pharmaceuticals (USA) Inc.: It operates as Zydus’s main subsidiary in the United States, focusing on manufacturing and marketing generic formulations approved by the U.S. FDA. A significant contributor to Zydus’s international revenue, given the high demand for generics in the U.S. market.
Zydus Healthcare Ltd: It manages Zydus’s branded formulations business in India, catering to a wide range of therapeutic areas such as cardiovascular, gastrointestinal, pain management, and oncology. A major revenue driver for Zydus in the Indian domestic market.
Zydus Animal Health and Investments Ltd: It provides animal health products across livestock, poultry, and companion animals, including treatments, nutritional supplements, and anti-infectives. It expands Zydus’s reach into veterinary and animal health segments, which are growing markets in India and internationally.
Zydus Biosimilars Ltd: A dedicated unit for biosimilars, developing and commercializing biosimilars for therapeutic areas like oncology, immunology, and nephrology. Positions Zydus as a key player in biosimilars, targeting high-growth opportunities in biologics.
Simayla Pharmaceuticals (South Africa) Pty Ltd.: Operates in South Africa, focusing on providing affordable generic and branded pharmaceuticals across a range of therapeutic areas. Extends Zydus’s market presence in Africa, catering to regional healthcare needs with affordable solutions.
Q2 FY25 & Business Highlights
Revenue of ₹5237 crore in Q2 FY25 up by 19.27% YoY from ₹4369 crore in Q2 FY24.
EBITDA of ₹1461 crore in this quarter at a margin of 28% compared to 26% in Q2 FY24.
Profit of ₹920 crore in this quarter compared to a ₹803 crore profit in Q2 FY24.
India branded formulations business posted double-digit growth and outpaced the market growth both in the chronic and acute segments. Consumer Wellness business delivered robust double-digit growth aided by strong volume uptake.
The US formulations business continued its upward journey with robust YoY growth driven by volume expansion and new product launches. International markets business grew in double-digit on the back of strong performance across key markets.
Capex for this quarter has been done by internal accruals and cash from the company worth ₹302 crore, for acquisition and patents.
India Formulations launched 12 new products (incl. line extensions) with 4 first-in-India launches. In the consumer wellness segment, growth was largely driven by strong 8.4% volume growth.
In Biotech and Vaccine R&D the company has completed patient recruitment for Phase III clinical trials for one of the biosimilars and follow-up has been completed and completed Phase II clinical trials for Hepatitis E vaccine.
Forayed into animal free fermentation-based protein business by forming a JV with Perfect Day Inc. through acquisition of 50% stake in Sterling Biotech Ltd (SBL).
SWOT Analysis:
Strengths:
Strong presence in the domestic market
Broad and diverse product portfolio
Advanced research and development capabilities
Significant global market footprint
Weaknesses:
Heavy reliance on the U.S. market
High expenditure on R&D
Exposure to patent litigation risks
Opportunities:
Expansion into biosimilars and specialty drugs
Government initiatives like the PLI scheme
Growth potential in the healthcare and wellness sectors
Threats:
Challenges in regulatory compliance and security
Pricing pressures in the market
Increasing competition from domestic and global players
Vinati Organics Limited (VOL), established in June 1989, is a prominent manufacturer in the specialty chemicals sector, with a global presence across 35 countries. With over 30 years of experience, VOL has evolved from a single-product manufacturer to a diversified, integrated business supplying chemicals to major industrial and chemical companies in the United States, Europe, and Asia. The company operates two state-of-the-art manufacturing units in Maharashtra (Mahad and Lote Parashuram), producing key products like Isobutyl Benzene (IBB), 2-Acrylamido 2 Methylpropane Sulfonic Acid (ATBS), IsoButylene (IB), and Butyl Phenols—crucial raw materials in the production of ibuprofen, a widely used pharmaceutical drug.
VOL went public in November 1991 to fund its manufacturing base in Mahad and began commercial production of IBB in 1992. It has benefited from a technical collaboration with Institut Français du Pétrole (IFP), France, which helped bolster its refining and petrochemical processes. Over the years, VOL expanded by acquiring land at Lote in 1999 to produce fine chemicals like Sodium Methallyl Sulfonate (SMAS) and Acrylamido Methylpropane Sulfonic Acid (ATBS), becoming the third company globally to produce ATBS. The company further diversified in FY 2014-15 with the launch of High Purity Methyl Tertiary Butyl Ether (HPMTBE), expanding into industries like pharmaceuticals and organic metallic compounds. By FY 2015-16, VOL also introduced N-Tertiary Octyl Acrylamide (TOA), used in personal care products and enhanced oil recovery. VOL improved its financial position by repaying long-term debt in FY 2017 and financing a Rs. 200 crore capex from internal accruals.
In recent years, VOL has invested Rs. 300 crores in projects like the Butyl Phenols plant and expanding ATBS capacity, which became operational by FY 2020, driving revenue growth. The company earned recognition, such as the STAR SME of the Year and Company of the Year in Chemicals awards in 2019. In 2020, VOL expanded by acquiring Veeral Organics Pvt. Ltd. as a subsidiary and embraced renewable energy, commissioning several solar power plants in Maharashtra. This strategic growth highlights VOL’s commitment to innovation, sustainability, and global expansion.
Industry Outlook
The specialty chemicals sector in India, where Vinati Organics (VO) operates, is witnessing strong growth driven by rising domestic and global demand across various end-use industries like pharmaceuticals, agrochemicals, personal care, and electronics. India’s specialty chemicals industry benefits from an ongoing global shift in manufacturing away from China due to environmental concerns, cost pressures, and geopolitical factors. Indian companies, like Vinati Organics, are capturing market share as international players seek alternative suppliers with reliable production and cost-effective solutions. This shift is expected to propel India’s specialty chemicals market, projected to grow at a double-digit CAGR over the next few years.
Globally, the specialty chemicals industry is poised for steady growth, supported by the expanding applications in sustainable products, renewable energy, and advanced technologies. Demand is strong in developed economies like the US, Europe, and Japan, which are increasingly adopting eco-friendly and efficient specialty chemicals, driven by regulatory and sustainability goals. Additionally, emerging markets in Asia-Pacific remain critical growth areas due to increasing industrialization and urbanization.
For Vinati Organics, this industry tailwind is favorable as the company is strategically expanding into high-demand areas like ATBS, antioxidants, and new product lines (e.g., MEHQ and guaiacol). The company’s ongoing projects, such as the ATBS capacity expansion and the launch of new antioxidants, align with increasing global demand, positioning Vinati Organics to benefit from rising industry trends. The strong focus on R&D and product diversification enables VOL to capture emerging opportunities in global markets.
India’s position as a leading hub for specialty chemicals production is strengthened by supportive government policies, investment incentives, and infrastructure improvements under Make in India and PLI schemes. As a result, Indian specialty chemical firms are well-positioned to compete globally, benefiting from competitive costs and robust manufacturing capabilities. Consequently, Vinati Organics is expected to achieve steady growth, supported by rising domestic and export demand, expanding its portfolio, and seizing global market opportunities in the specialty chemicals sector.
Business Segments
Vinati Organics Limited (VOL) operates across several key business segments in the specialty chemicals industry, each serving critical applications across multiple sectors. Here’s a breakdown of VOL’s primary business segments:
Acrylamide Tertiary Butyl Sulfonic Acid (ATBS): ATBS is VOL’s flagship product and a significant revenue contributor, accounting for around 36% of the company’s total revenue as of recent quarters. This product is used extensively in industries such as water treatment, adhesives, oil recovery, and construction chemicals. As one of the world’s largest ATBS producers, VOL has continually expanded its ATBS capacity to meet rising global demand, making it a cornerstone of the company’s portfolio.
Isobutyl Benzene (IBB): IBB is a critical raw material used in the manufacture of ibuprofen, a widely used pharmaceutical ingredient. VOL is one of the largest global manufacturers of IBB, enabling it to secure long-term contracts with pharmaceutical companies worldwide. This product supports VOL’s footprint in the pharmaceutical chemicals market.
Antioxidants: The antioxidants segment is a rapidly growing area for VOL. These antioxidants are used primarily in the food, polymer, and lubricant industries to prevent oxidation, prolonging product shelf life and stability. VOL’s revenue from this segment is expected to double in FY25, reflecting strong demand growth.
Butyl Phenols: VOL has expanded into Butyl Phenols, which are derived from Isobutylene and are critical in the production of various plasticizers, resins, and stabilizers. This product segment diversifies VOL’s offerings and supports demand in sectors like automotives and consumer goods.
Isobutylene (IB) and Specialty Derivatives: Isobutylene is a versatile chemical used as an intermediate in specialty chemicals, polymers, and fuel additives. VOL’s production of isobutylene and its derivatives, including products like High Purity Methyl Tertiary Butyl Ether (HPMTBE) and N-Tertiary Octyl Acrylamide (TOA), supports applications in personal care, adhesives, and enhanced oil recovery.
MEHQ and Guaiacol: VOL recently launched MEHQ (Monomethyl Ether Hydroquinone) and Guaiacol, used in pharmaceuticals and chemical intermediates. Commercial production started in 2024, and these products are currently being sampled with customers. They are expected to contribute significantly to VOL’s revenue from FY26 onward.
These diversified segments underscore VOL’s strength in delivering specialized chemicals across critical industries, positioning it as a reliable supplier with a broad portfolio tailored to meet varied industrial needs.
Key Subsidiaries and Their Information
Vinati Organics Limited (VOL) has a key subsidiary, Veeral Organics Private Limited, which plays a strategic role in VOL’s expansion and diversification efforts. Here’s an overview and recent developments related to Veeral Organics and VOL’s other key operational moves.
Veeral Organics Private Limited, established in October 2020 as a wholly-owned subsidiary of Vinati Organics Limited (VOL), enhances VOL’s specialty chemical capabilities by expanding into high-demand chemical segments. The subsidiary focuses on developing antioxidants, advanced intermediates, and custom chemical solutions with applications across pharmaceuticals, agrochemicals, and personal care industries. Recent advancements include new product trials such as MEHQ (Monomethyl Ether Hydroquinone) and Guaiacol, which have gained traction in the pharmaceutical sector. To streamline operations, VOL initiated an amalgamation of Veeral Additives Private Limited in February 2021, supporting its growth in core and specialty intermediates.
VOL’s ongoing capital expenditure of around Rs. 300 crore focuses on expanding ATBS production and setting up new capacities, with Veeral Organics contributing to the rise in antioxidants and intermediates production. Sustainability efforts include renewable energy projects, with significant solar installations in Maharashtra. Veeral Organics’ products are projected to impact revenues notably by FY26, aligning with VOL’s goal of doubling its revenue in the coming years. This expansion strengthens VOL’s market position as a leading global specialty chemicals manufacturer with a diverse, high-growth product portfolio.
Q2 FY25 Highlights
Strong YoY Topline Growth: Both standalone and consolidated revenue reached Rs 553 crore (a 19.5% YoY increase and 5.4% QoQ growth), meeting analysts’ expectations (projected at Rs 547 crore). The H1 FY25 revenue showed a 19.5% growth compared to H1 FY24, signaling healthy expansion. The gross profit margin remained stable at 45.8% YoY, with a slight sequential improvement, due to a moderate reduction in raw material costs. Key contributors to revenue included ATBS (36%), Butyl Phenols (21%), IBB (11%), and Antioxidants (11%), with other products making up the remaining 21%.
EBITDA Margin Increase: The company’s EBITDA rose by 27.9% YoY and 7.1% QoQ, amounting to Rs 134 crore. The EBITDA margin (EBITDAM) improved to 24.2% in Q2 FY25, up by 160 basis points YoY and 40 basis points QoQ, reflecting the company’s operational efficiency. These margins exceeded projections, which were set at 23.5%.
PAT Margin Expansion: The standalone Profit After Tax (PAT) was reported at Rs 106.1 crore, representing a 46.4% YoY growth and 23.5% QoQ increase. The PAT margin expanded by 300 basis points sequentially, reaching 19%, driven in part by a significant 140% rise in other income to Rs 22.2 crore.
The ATBS production capacity is on track to increase from 40,000 MTPA to 60,000 MTPA by H2 FY25, which is expected to further boost revenue. Revenue from antioxidants reached Rs 100 crore in H1 FY25, with the target of Rs 200-250 crore by FY25. Management maintained a 20% revenue growth forecast for FY25.
In summary, Vinati Organics demonstrated robust YoY and QoQ growth across revenue, EBITDA, and PAT, supported by volume increases, a stable cost structure, and product mix expansion. The planned ATBS capacity increase and introduction of new antioxidants position the company for continued revenue growth and market expansion in FY25.
Britannia Industries Ltd., one of India’s leading FMCG companies, has established a prominent position in the food and beverages sector, primarily focusing on bakery products. Known for its vast portfolio of biscuits, bread, cakes, dairy products, and other snacks, Britannia enjoys high brand recognition and consumer trust across India and in various international markets. Britannia is best known for its biscuit brands, commanding over 30% market share in India. Britannia has established a strong distribution network of 30000, reaching both urban and rural markets, helping it maintain a leading position in India’s competitive biscuits market. Britannia has a growing international presence, operating in over 70 countries, including the Middle East, Africa, North America, and Southeast Asia. Britannia has 13 manufacturing facilities across India, producing a wide range of products with a focus on quality and efficiency. It also has an extensive network of third-party manufacturing units. Britannia’s robust portfolio, brand strength, extensive distribution, and continuous innovation place it at a strong position within India’s FMCG sector.
Industry Outlook
The Indian Fast-Moving Consumer Goods (FMCG) industry is one of the most robust and dynamic sectors, driven by strong demand, population growth, rising income levels, and increased urbanization. The Indian FMCG sector is projected to grow at a CAGR of 10-12% over the next five years, driven by rural market expansion, rising incomes, and a favourable demographic dividend. As of recent estimates, the FMCG market in India is valued at over $110 billion, making it the fourth-largest sector in the Indian economy. Rural demand now contributes to 45-50% of total FMCG sales and is expected to continue growing. Rising disposable incomes are shifting consumption patterns toward premium and value-added products. Online FMCG sales have grown rapidly, particularly in urban areas, and are expected to account for 10-12% of FMCG sales by 2025.
Financial Summary
INR Cr.
Q1 FY25
Q2 FY25
FY23
FY24
Revenue
4250
4668
16301
16769
EBITDA
753
780
2831
3167
OPM
18%
17%
17%
19%
PBT
681
715
3033
2913
Net Profit
505
532
2316
2134
NPM
11.8%
11.4%
14.2%
12.7%
EPS
20.99
22.06
96.39
88.84
C&CE
215
250
198
446
Business Segments:
Bakery Business: It involves many sub segments in it, Biscuit is a major part of this segment and is continued to grow. Cakes are in category continuous to grow in of ₹5-10 price points products and large priced products are having substantial growth. Rusk is having some tough competition from its strong new entrants. In bread category, it is having a great growth as more demand from consumers with over turnover of ₹450 crore.
Dairy Business: It involves cheese and drinks like Lassi which is showing a healthy double digit growth. Packaged liquid milk remains a key growth driver of the industry, healthy demand and growth is also expected in cheese, yogurt and other value added dairy products.
Adjacent Business: This segment has Wafers which is highly fragmented market of ₹1000 crore. Croissant is also a product of Britannia in this segment, able to achieve good growth in urban areas. Salted snacks or packets is a growing at double digit rate and is most profitable and high volume category.
International Business: International Business for the Company is largely centered on Middle East, Americas, Africa and Asia Pacific. The business environment in these geographies is highly competitive with the presence of large local and international players. And exports contribute around 6% in the revenue.
Subsidiary Information:
These are majorly big subsidiaries of Britannia Industries established in India and all over the world. But, there are total over 25+ subsidiaries under it.
Manna Foods: Manna Foods allows Britannia to tap into the health and wellness market, expanding its footprint in the packaged foods segment. The yearly turnover for this subsidiary is ₹367 crore, It provides traditional and health-focused foods like millet-based products and ready-to-cook items.
AI Sallan Food Industries: This subsidiary helps Britannia access new markets and diversifies revenue streams outside of India. It manufactures and distributes bakery products, primarily in Oman and the Middle East. It had a main focus of international expansion and it has a turnover of ₹ 231 crore in FY24.
Britannia Nepal Pvt Ltd: This entity manufactures and distributes Britannia’s core product lines in Nepal, catering to local demand and establishing a stronger footprint in South Asia. Enables Britannia to reduce logistics costs and gain market share in Nepal’s packaged food sector.
Strategic Foods International Co. Ltd: It is based in Dubai have product categories of biscuit, cookies and cakes. Predominantly in the Middle East and Africa, where it taps into a growing demand for packaged food and snacks. It plays a key role in diversifying Britannia’s revenue streams beyond India, supporting the company’s goal of becoming a global food brand.
Q2 FY25 & Business Highlights
Revenue of ₹4668 crore in Q2 FY25 up by 5.29% YoY from ₹4433 crore in Q2 FY24.
EBITDA of ₹780 crore in this quarter at a margin of 17% compared to 20% in Q2 FY24.
Profit of ₹532 crore in this quarter compared to a ₹586 crore profit in Q2 FY24.
Metro FMCG growth rate is lower compared to Urban and Rural regions of India.
Adjacent Businesses are doing really well in cake, wafers, Rusk, Cheese and Drinks.
Commodity prices of Sugar, Cocoa, Flour Oils, etc. are increasing due to inflation, which will affect the profitability.
Capex of ₹450-₹500 crore is planned to use in FY25, through internal accruals, long-term debts and cash and use it to expand in India and International markets.
SWOT Analysis:
Strengths
Established brand with strong recognition.
Wide-ranging product portfolio.
Broad and effective distribution network.
Weaknesses
Heavy reliance on the biscuits segment.
High sensitivity to input cost fluctuations.
Opportunities
Expansion into dairy and health food categories.
Potential growth in untapped rural markets.
Opportunities for mergers, acquisitions, and partnerships.
Threats
High levels of competition in the market.
Volatility in raw material prices.
Potential impacts from economic slowdowns.
Rising health consciousness shifting consumer preferences.
Divi’s Laboratories Ltd., a major global API (Active Pharmaceutical Ingredients) manufacturer, was founded in 1990 as Divis Research Center, focusing initially on Research & Development. Today, it stands as one of the largest API companies worldwide, specializing in Intermediates, Nutraceuticals, and custom synthesis for innovator pharmaceuticals. It has a significant export-oriented business, with a presence in over 100 countries, supplying around 160 diverse products. Divi’s Laboratories Ltd. has achieved significant milestones in its growth and operations. In 1995, the company established its first manufacturing unit in Choutuppal near Hyderabad. Over the years 1997-2001, it earned ISO-9002 and OHSAS-18001 certifications, underlining its commitment to quality and safety standards. By 2002, Divi’s expanded further with a second manufacturing facility at Chippada, Visakhapatnam, which later became an Export Oriented Unit (EOU), enhancing global reach.
In 2006-2008, the company developed Divi’s Pharma SEZ in Visakhapatnam for Nutraceutical production, expanding its custom synthesis and Nutraceutical portfolio to meet rising export demand. In 2011, Divi’s launched the DSN SEZ Unit at Visakhapatnam, increasing production capacity in generic and custom synthesis segments.
From 2014-2018, Divi’s Laboratories passed multiple international regulatory inspections, including from the US FDA and COFEPRIS (Mexico), establishing EIR status for Unit-II, Visakhapatnam, which addressed previous regulatory concerns. The company invested ₹1200 crore in 2019-2020 in brownfield projects, creating DC SEZ and DCV SEZ units that became fully operational in FY2021. These projects boosted Divi’s role in generic and big pharma markets. In 2023, Divi’s launched Unit-III in Kakinada, Andhra Pradesh, further expanding production capacity.
In line with its dedication to innovation and compliance, Divi’s has research centers in Hyderabad and at manufacturing sites, focusing on custom synthesis and process innovations. With two subsidiaries—Divi’s Laboratories (USA) Inc. and Divi’s Laboratories Europe AG in Switzerland—the company enhances its reach in Nutra product markets. Divi’s continued investments in R&D, global regulatory compliance, and strategic expansion reinforce its commitment to high-quality pharmaceutical solutions, positioning it as a prominent player in the global API market.
Financial Overview
Industry Outlook
The Indian pharmaceutical sector is experiencing both near-term challenges and long-term growth potential driven by strategic expansions, cost efficiency, and new market opportunities. Key factors impacting the sector include pricing pressures in generic products and logistics challenges due to disruptions like the Red Sea crisis, which has extended shipping times and increased costs. Many companies are proactively managing inventory and supply chains to mitigate these impacts, such as advancing shipments and diversifying supply sources.
In the generic business, pricing pressure remains a challenge, but there is healthy volume growth in base businesses. Companies are expanding their portfolio to address loss of exclusivity (LOE) for several drugs, projected for 2026, which opens opportunities to capture market share in high-value molecules. This trend aligns with the pharmaceutical sector’s increasing focus on specialty and complex products and API (Active Pharmaceutical Ingredient) markets, which are seeing robust demand.
Custom synthesis continues to drive growth, with rising demand from both new and existing customers. Many companies have expanded into contrast media manufacturing, particularly iodine- and gadolinium-based molecules, which present a growing opportunity in global diagnostic markets with an annual growth rate of around 10-15%.
The API sector is well-positioned for sustained growth as global companies look for reliable alternative suppliers due to changing procurement strategies. With recent capacity expansions across SEZ units in India, companies can leverage low input costs in areas like raw materials, freight, and power to enhance profit margins. As inflation moderates globally, Indian pharmaceutical companies may also benefit from cost rationalization strategies, improving their competitiveness.
Divi’s Laboratories and other Indian firms are positioned to capitalize on the long-term trend of increased API demand and are exploring new opportunities in contract media and GLP-1 products. As the global addressable market for contrast media grows (estimated at USD 4-6 billion), firms expanding in this space can anticipate sustained demand for innovative and cost-effective solutions. Meanwhile, backward integration and advanced R&D capabilities are key strategies, enabling companies to streamline production costs and strengthen market positions over the long term.
In summary, while near-term challenges like pricing pressure and logistics disruptions persist, the pharmaceutical sector’s shift toward specialty products, cost-efficiency, and expanded capacities paints a promising outlook for the long-term. Indian companies’ strategic investments in innovation, compliance, and operational efficiency will likely enable them to maintain double-digit revenue growth while meeting the increasing demands of the global pharmaceutical market.
Business Segments
Divi’s Laboratories has demonstrated strong segmental performance across several key areas, including generic APIs, custom synthesis, peptides, contrast media, and ongoing capacity expansions at strategic units. Each of these segments reflects the company’s focus on meeting growing demand while managing industry challenges such as pricing pressures and supply chain disruptions.
Generic APIs: Divi’s generic business has experienced healthy double-digit volume growth, although pricing pressure persists across the industry. Despite the pricing environment, Divi’s has expanded its market share in smaller API molecules, highlighting the company’s resilience and strategic positioning in the generic segment. Emerging generic products have also shown robust performance, underscoring Divi’s adaptability in a competitive space.
Custom Synthesis: There is a notable increase in demand for Divi’s custom synthesis services from both new and existing clients. The future pipeline for this segment appears strong, with a robust set of products advancing through various stages of development. Key contributions from this segment are expected to start from FY26, aligning with the company’s long-term growth vision.
Peptides: Divi’s Laboratories has placed significant emphasis on GLP-1 compounds within the peptide segment, focusing on solid-phase synthesis to meet customer-specific requirements. The company is also expanding capacities for these peptide products, especially for solid-based peptides used in GLP-1 fragments, a growing therapeutic area. This focus enhances Divi’s specialty offerings, enabling it to cater to high-demand, niche markets.
Contrast Media: The contrast media segment has delivered impressive results, with volume growth of 20-30% YoY. Divi’s engagement with major clients in this area is progressing, with various projects moving to advanced stages. The company is actively working on iodine-based molecules (some nearing commercialization) and gadolinium-based molecules (in qualification stages, with potential for commercialization by FY26/27). Increased RFPs (Request for Proposals) from customers in this segment underscore the growing demand for Divi’s contrast media products.
Kakinada Unit (Unit-III): Divi’s Greenfield expansion at Kakinada is progressing as planned, with Rs. 11.8 billion spent as of H1 FY25. Production is set to commence in December 2024 in a phased manner. This unit is part of Divi’s strategy to expand capacity for both regulatory and custom synthesis products, supporting future growth in demand.
Logistics and Supply Chain: Divi’s has been proactive in managing inventory and logistics challenges, particularly those arising from the Red Sea disruptions that increased transit times to 70 days. The company has addressed these challenges by advancing shipments by 3-4 weeks and maintaining higher safety stock to minimize supply interruptions.
Key Subsidiaries and Their Information
Divi’s Laboratories operates through two major subsidiaries, Divis Laboratories (USA) Inc. and Divi’s Laboratories Europe AG. These subsidiaries play a strategic role in the company’s global expansion and focus on specialized markets for pharmaceutical ingredients, particularly in custom synthesis and nutraceuticals.
Divis Laboratories (USA) Inc.: This subsidiary caters primarily to the North American market, focusing on the distribution and marketing of nutraceutical products and custom synthesis services. It helps Divi’s Laboratories establish a strong presence in the US, one of the largest pharmaceutical markets globally, and aligns with Divi’s mission to support local customer requirements while meeting stringent regulatory standards. It contributes significantly to the company’s nutraceutical portfolio growth and has enhanced relationships with major pharmaceutical clients by providing reliable supply chains and custom synthesis offerings tailored to local industry needs.
Divi’s Laboratories Europe AG (Switzerland): This subsidiary focuses on European markets, providing nutraceutical and pharmaceutical ingredients and supporting custom synthesis projects for clients in Europe. Divi’s Laboratories Europe AG serves as a critical hub for European operations and facilitates compliance with EU regulatory standards. It also strengthens Divi’s supply chain resilience by creating a local presence in Europe, enhancing service delivery and customer support. In FY25, Divi’s Laboratories Europe AG has seen robust demand in nutraceuticals, particularly for ingredients with high-quality standards essential for the European market. This subsidiary plays a key role in Divi’s market penetration in Europe, contributing to the company’s overall revenue growth.
These subsidiaries support Divi’s Laboratories’ strategic goals of expanding its global footprint and catering to diverse regional needs in the pharmaceutical and nutraceutical industries. They also provide a platform for Divi’s to directly engage with key markets, ensuring regulatory compliance, effective supply chains, and tailored customer support, aligning with the company’s vision of global operational excellence.
Q2 FY25 Highlights
Divi’s Laboratories reported consolidated total income of ₹2,444 crore, a 22.5% increase compared to ₹1,995 crore in the same quarter of the previous year. For the half-year ended 30th September 2024, Divi’s Laboratories posted a consolidated total income of ₹4,640 crore, up by 20.4% from ₹3,854 crore in the same period of the previous year. This consistent revenue growth reflects the company’s ability to expand its product portfolio and global footprint.
Profit Before Tax (PBT) for the quarter was ₹722 crore, a substantial rise of 54% from ₹469 crore in the corresponding period last year. This increase in PBT highlights improved profitability driven by efficient operations and cost management. The PBT for the half-year was ₹1,326 crore, up from ₹961 crore, marking a 38% increase.
Profit After Tax (PAT) for the quarter stood at ₹510 crore, showing a significant 46.6% growth compared to ₹348 crore in the previous year. This reflects the company’s strong bottom-line performance, driven by both operational growth and improved cost efficiencies. PAT for the half-year was ₹940 crore, a significant 33.5% increase from ₹704 crore in the corresponding period of the previous year, reflecting robust operational performance and better margins.
The company also reported a foreign exchange (forex) gain of ₹29 crore for the quarter, which is a notable increase from the ₹1 crore gain recorded in the same quarter of the previous year. The company also recorded a forex gain of ₹28 crore for the half-year, compared to ₹14 crore in the previous year, further contributing to the positive financial results. The forex gain likely provided additional support to the bottom line.
Greenfield expansion at Kakinada Unit(III) is progressing as planned, with Rs. 11.8 billion spent as of H1 FY25. Production is set to commence in December 2024 in a phased manner. This unit is part of Divi’s strategy to expand capacity for both regulatory and custom synthesis products, supporting future growth in demand.
Divi’s has been proactive in managing inventory and logistics challenges, particularly those arising from the Red Sea disruptions that increased transit times to 70 days. The company has addressed these challenges by advancing shipments by 3-4 weeks and maintaining higher safety stock to minimize supply interruptions.
Financial Summary
INR in Cr.
Q2FY25
Q1FY25
Q2FY24
Q-o-Q (%)
Y-o-Y (%)
Revenue from Operation
2,338
2,118
1,909
10%
22%
Other Income
106
79
86
34%
23%
Total Income
2,444
2,197
1,995
11%
23%
Total Expenditure
1,622
1,496
1,430
8%
13%
Operating profit
716
622
479
15%
49%
Other Income
106
79
86
34%
23%
Interest
1
0
1
0%
0%
Depreciation
99
97
95
2%
4%
PBT
722
604
469
20%
54%
PAT
510
430
348
19%
47%
EPS (Rs.)
19.2
16.2
13.11
19%
46%
SWOT Analysis: Key Insights
Strengths
Market Leadership: Strong foothold in the industry with a leading market position.
Robust Manufacturing: Advanced manufacturing capabilities that ensure high-quality production.
Research Focus: Commitment to R&D fuels innovation and keeps the company competitive.
Outstanding Performance: Consistently strong financial and operational performance.
Weaknesses
Regulatory Risks: Exposure to regulatory changes can impact business operations.
High Dependency on API: Reliance on active pharmaceutical ingredients (API) poses risks.
Limited International Reach: Lack of significant presence in global markets limits growth potential.
Opportunities
Rising Global Demand: Increasing demand for pharmaceutical products worldwide.
New Product Development: Expanding product lines can capture new market segments.
Technological Innovations: Leveraging technology to enhance production and product quality.
Threats
Price Pressure: Competitive pricing in the market can impact profit margins.
Intense Competition: Facing stiff competition from both domestic and international players.
Supply Chain Vulnerabilities: Disruptions in the supply chain could affect operations.
On November 12, 2024, engineering giant Larsen & Toubro (L&T) has announced a major contract from NTPC for developing thermal power plants in Madhya Pradesh and Bihar. Although L&T has not disclosed the precise value of this ‘limited notice to proceed’ (LNTP) order, estimates from analysts suggest a value close to ₹22,000 crore, ranking among the company’s largest domestic projects, similar to its 2020 bullet-train contract for the Mumbai-Ahmedabad High-Speed Rail Project.
Order Details and Strategic Shift
The project includes a 2×800 MW thermal power plant at Gadarwara in Madhya Pradesh and a 3×800 MW plant at Nabinagar in Bihar. This order is particularly noteworthy as it signals a change in L&T’s strategy; the company had previously decided against bidding for thermal power projects due to unfavourable contract terms. However, recent discussions led to a strategic reversal, as explained by Subramanian Sarma, President (Energy) and Whole-Time Director of L&T, during an October media call.
Background and Historical Wins
This order win adds to L&T’s substantial order book, which stood at ₹5.1 trillion as of September 2024, with 40% of projects based internationally, especially in West Asia. L&T’s recent win rivals the scale of its 2020 contract to construct a 237.1-km section of the Mumbai-Ahmedabad high-speed rail (MAHSR) project, previously its largest engineering, procurement, and construction (EPC) contract in India.
Market Performance
On the day of the announcement, L&T’s stock closed at ₹3,547.95 on the BSE, a decrease of 1.21%. The stock price has fluctuated within a 52-week range of ₹3,031.05 to ₹3,948.60, reflecting investor responses to the company’s high-value order book and strategic shifts.
Asian Paints Ltd. is India’s largest paint manufacturer and one of the leading paint companies globally. Founded in 1942, it operates in more than 15 countries and has over 26 paint manufacturing facilities worldwide. It is No.1 or No.2 in its each segment, showing a great brand. Its product portfolio extends beyond decorative paints to include industrial paints, coatings, home decor, and waterproofing solutions, serving residential, commercial, and industrial markets. It has more than 140,000 customers and 3000+ dealers and 160,000+ retail touchpoints. The company has filed approx. 21 patents, Asian Paints has established itself as the most recognizable brand in India’s paint market. Through initiatives like the ‘Beautiful Homes Service’ and online colour consultation tools, Asian Paints enhances customer experience, leveraging digital solutions to strengthen customer engagement.
Industry Outlook
The Indian paints industry is projected to grow at a CAGR of 11-13% over the next five years, aiming to reach a valuation of ₹1.2 lakh crores by 2028. Demand for water-based paints, low-VOC (Volatile Organic Compounds) products, and anti-bacterial coatings is on the rise, driven by eco-conscious and health-focused consumers. Major players, such as Asian Paints and Berger Paints, are continuously investing in R&D for product innovation and are expanding manufacturing capacities to meet rising demand. Infrastructure growth and government focus on boosting the manufacturing sector are expected to increase demand for industrial coatings, especially in construction, automotive, and machinery sectors. Crude oil derivatives are key inputs for paint manufacturing, and price fluctuations can impact profit margins.
Financial Summary
Business Segments:
Decorative Business: The Company offers interiors and exterior wall paints, waterproof solutions, textured coatings, etc. with major products like Royale, TruCare, Apcolite, etc. It includes service of Beautiful Homes Service which shares about 4% in total revenue of company and includes services for kitchens, wardrobes, bath fittings, Sanitaryware, decorative lightings, rugs, furniture, etc. provides customers every possible services.
International Business: Asian Paints has a global footprint with manufacturing operations and markets across 15+ countries in the Middle East, South Asia, Southeast Asia, and the Caribbean. While international operations currently represent a smaller portion of total revenue, they contribute to the company’s goal of becoming a leading player in emerging markets.
Industrial Business: The Company operates in the industrial coatings segment through a 50:50 joint ventures with PPG Industries Inc. It offers custom-formulated products for the automotive and industrial sectors, including automotive, marine, and packaging coatings, as well as industrial protective coatings.
Q2 FY25 & Business Highlights
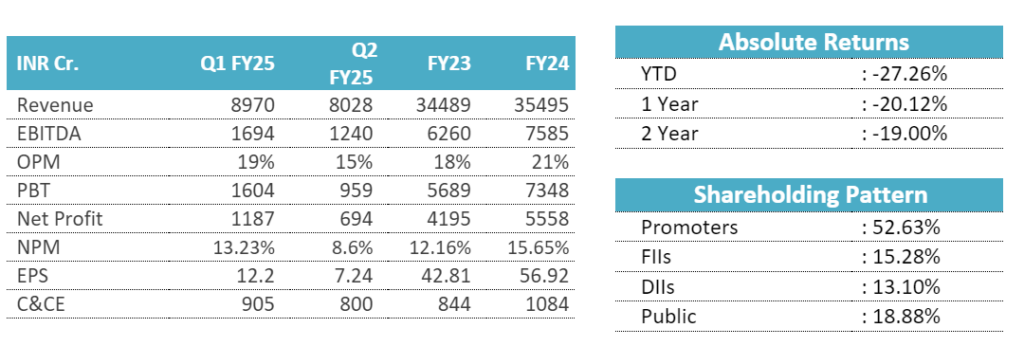
Revenue of ₹8028 crore in Q2 FY25 down by 5.32% YoY from ₹8479 crore in Q2 FY24.
EBITDA of ₹1240 crore in this quarter at a margin of 15% compared to 20% in Q2 FY24.
Profit of ₹694 crore in this quarter compared to a ₹1232 crore profit in Q2 FY24.
Decorative Business registered volume decline of 0.5% with revenue decline of 6.7%, due to weak consumer sentiments coupled with rains and floods in some part country impacted the consumption.
All categories in the Home Decor business benefited from synergies with our Beautiful Homes stores network, though at a lower clip than expectations.
Forex loss on currency devaluation (₹ 56 crore in Ethiopia) along with subdued performance in Asia impacted overall profitability
International business registered a marginal value decline despite some challenging market conditions in Ethiopia and Bangladesh. Though on a constant currency basis, the international portfolio delivered revenue growth of 8.7% for the quarter.
Subsidiary Information:
Asian paints international Pvt Ltd.: Asian Paints International Private Limited (“APIPL”), Singapore, is a wholly-owned subsidiary of the Company and is the holding company for all of its subsidiary companies carrying out operations overseas. The principal activities of APIPL are those of investment holding and management. The Board of Directors at its meeting held on 28th March 2024, approved an investment of approximately ₹200 crores by way of subscription of equity shares of APIPL, for repayment of borrowings.
Asian Paints (Nepal) Pvt Ltd: Asian Paints (Nepal) Private, is a subsidiary company of the Company. Its principal business is the manufacturing and selling of paint products in Nepal. The revenue of AP Nepal was ₹335.04 crores with de-growth of 38.5% YoY.
Obgenix Software Pvt Ltd: It is popularly known by the brand name “White Teak” is a subsidiary company of the Company. White Teak is engaged in the business of decorative lighting products, fans and other décor accessories. The revenue of White Teak was ₹133.43 crores with growth of 23.0% YoY.
Weather seal Fenestration Pvt Ltd: It is a subsidiary company of the Company. Weatherseal is engaged in the business of uPVC windows and doors. The revenue of Weatherseal was ₹51.68 crores growth of 110.0% year on year.
Zuari Agro Chemicals Ltd, incorporated in 1967, is a leading manufacturer and trader of chemical fertilizers and agricultural products under the Adventz Group. Serving farmers across India under the ‘Jai Kisaan’ brand, the company provides a range of fertilizers, pesticides, seeds, and water-soluble fertilizers to meet diverse agricultural needs. The company operates as a single-window agricultural solution provider, manufacturing high-quality complex fertilizers, including Single Super Phosphate (SSP), which enhances soil productivity. SSP, a phosphatic multinutrient fertilizer, contains 16% citrate-soluble P205, 14.5% water-soluble P205, 12% sulphur, and 21% calcium.
In FY23, Zuari Agro achieved significant production and sales volumes across various products, including Urea (~38,203 MT), Other Complex Fertilizers (~42,816 MT), and Single Super Phosphate (SSP) (~100,029 MT). Sales figures for Urea reached ~46,674 MT, while Di-Ammonium Phosphate sales stood at ~8 MT and Other Complex Fertilizers at ~187 MT. The company’s total SSP sales were ~90,174 MT, broken down into Granular SSP (~77,886 MT) and Powdered SSP (~12,288 MT), with Maharashtra contributing ~75,640 MT and Karnataka ~14,534 MT. For FY24, Zuari Agro plans to boost SSP sales to ~1.25 lakh MT, including 103,407 MT Granular and 21,864 MT Powdered.
The revenue composition for FY23 showed Finished Products accounting for 61% of revenue, Traded Products at 8%, Interest Income at 4%, and Profit from Asset Disposal at 23%. In FY22, Zuari Agro executed a Business Transfer Agreement with Pradeep Phosphates Limited (PPL), approving a slump sale of its Goa fertilizer plant and associated business assets for USD 280 million. PPL is a subsidiary of Zuari Maroc Phosphates Pvt Ltd, a 50:50 joint venture with Office Chérifien des Phosphates (OCP).
In addition, the company provided Inter-Corporate Deposits (ICDs) amounting to AED 60,000 to its wholly-owned subsidiary, Adventz Trading DMCC in FY23, with total ICDs of AED 1.025 million written off, pending Reserve Bank of India (RBI) approval. On February 26, 2024, Zuari Agro signed a sale deed with Zuari Infinity Pvt Ltd for 216,015 sq. meters of land in Sancoale, South Goa. All these highlights Zuari Agro’s diverse fertilizer portfolio, strategic transactions to streamline operations, and financial arrangements aimed at supporting its growth in the agricultural solutions market.
Industry Outlook
Zuari Agro Chemicals is expected to experience steady growth in FY25 and beyond, supported by multiple positive trends in the agriculture and fertilizer sectors. Key drivers for this growth include a growing emphasis on sustainable farming practices, a rise in demand for nutrient-efficient fertilizers like Single Super Phosphate (SSP), and government policies that favor balanced fertilizer use to improve crop yields. The expansion of Zuari’s Jai Kisaan brand and investments in production capacity are well-aligned with these industry trends, as they position the company to capitalize on both policy support and increasing demand for high-quality agro-inputs.
The company’s strategic move to divest non-core assets, like the sale of its Goa fertilizer plant to Paradeep Phosphates in FY22, enables it to focus on core operations, streamline its business model, and potentially improve profitability through efficient resource allocation. This restructuring aligns with its broader strategy of enhancing operational efficiency and targeting sustainable growth opportunities.
Looking at the sector overall, the Indian fertilizer market is projected to grow at a CAGR of approximately 4.3% from 2024 to 2032. This growth is largely due to increasing demand for biofertilizers and complex fertilizers as well as government incentives encouraging balanced nutrient use across the agricultural sector. Government programs like the Mission for Integrated Development of Horticulture (MIDH) and Pradhan Mantri Kisan Samman Nidhi are promoting crop diversification and increased productivity, which in turn boost demand for quality fertilizers. The sector also benefits from investments in cold storage and logistics, which are essential for minimizing post-harvest losses, thereby enhancing efficiency. The rise of digital tools, such as the Krishi-Decision Support System (Krishi-DSS), is helping farmers with vital data on soil health, weather, and crop management, which further supports growth in the fertilizer sector.
Moreover, demand is rising for specialty fertilizers, particularly phosphatic and potash-based products, as these are crucial for high-yield crops and improve soil productivity. The government’s backing of biofertilizers also reflects a growing focus on sustainable farming practices. This sectoral push for enhanced crop productivity and environmentally responsible fertilizers underlines the promising growth trajectory for companies like Zuari Agro Chemicals.
Business Segments
Zuari Agro Chemicals operates through multiple business segments, focusing primarily on manufacturing, trading, and marketing of fertilizers and other agricultural products under its Jai Kisaan brand. Here’s a breakdown of its main business activities as of FY25:
Fertilizers: Zuari produces a variety of fertilizers, including urea, diammonium phosphate (DAP), and nitrogen-phosphorus-potassium (NPK) complex fertilizers. Additionally, it offers Single Super Phosphate (SSP), a significant product aimed at enhancing soil productivity. Specialty fertilizers, which are used for specific crop needs, and water-soluble options also fall under this segment. In FY23, the company produced approximately 100,029 metric tons (MT) of SSP, among other products.
Crop Protection: Besides fertilizers, Zuari supplies pesticides and micronutrients, enhancing crop resilience and health. This segment includes both traded and manufactured goods, catering to the diverse agricultural needs of Indian farmers.
Agri-Retail: Zuari’s retail division provides an extensive range of agricultural inputs, including seeds, agrochemicals, and farming equipment. Its Jai Kisaan Junction outlets serve as hubs for agricultural solutions, offering direct access to Zuari’s products and valuable agricultural guidance.
This strategic alignment positions Zuari well to leverage growth opportunities driven by rising demand for balanced fertilizers and government support for sustainable farming. The Indian fertilizer market is expected to grow at a very fast pace, supported by government incentives and the shift towards sustainable, high-yield farming practices
Key Subsidiaries and Their Information
Zuari Agro Chemicals Limited (ZACL) operates with a network of key subsidiaries and joint ventures, which enhance its market reach, production capabilities, and product portfolio across the agri-solutions sector. Here are the primary subsidiaries and joint ventures of Zuari Agro Chemicals and their contributions:
Mangalore Chemicals and Fertilizers Limited (MCFL): MCFL is a significant subsidiary of Zuari Agro and one of India’s leading chemical fertilizer manufacturers, based in Karnataka. It produces various fertilizers, including urea, diammonium phosphate (DAP), muriate of potash (MOP), and complex fertilizers. Urea and complex fertilizers are among MCFL’s core offerings. It also supplies micronutrients and soil conditioners, providing comprehensive fertilizer solutions. MCFL’s production and distribution capabilities expand Zuari Agro’s footprint in South India, specifically enhancing its presence in the southern agricultural markets and aligning with government initiatives to promote balanced fertilizer usage.
Zuari FarmHub Limited (ZFL): ZFL as a subsidiary of Zuari Agro focuses on agricultural retail and serves as Zuari Agro’s direct channel to farmers, offering a wide range of inputs and advisory services. Through the Jai Kisaan Junction outlets, ZFL provides fertilizers, seeds, pesticides, and agricultural equipment, creating a one-stop solution for farmers. It also offers crop-specific advice and farming solutions, promoting modern and efficient agricultural practices. ZFL strengthens Zuari’s outreach to Indian farmers, helping farmers access high-quality inputs and valuable information, ultimately enhancing farm productivity.
Zuari Maroc Phosphates Private Limited (ZMPPL): It’s a Joint Venture with Office Chérifien des Phosphates (OCP) from Morocco. ZMPPL focuses on phosphatic fertilizers, with a notable stake in Paradeep Phosphates Limited. This JV leverages OCP’s global expertise in phosphates, supporting Zuari Agro’s supply chain and product diversification. This partnership helps ensure a reliable supply of phosphate, a crucial component for fertilizer production, which supports Zuari’s business resilience against supply chain fluctuations.
Paradeep Phosphates Limited (PPL): It is the Subsidiary of ZMPPL, with a major share owned by Zuari Maroc Phosphates. PPL operates one of India’s largest fertilizer plants in Paradeep, Odisha, producing DAP, NPK, and other phosphatic fertilizers The acquisition of Zuari’s Goa plant strengthened PPL’s production base, contributing to its role as a major supplier of fertilizers in eastern India. This boosts the group’s overall production capacity and its reach within the Indian market.
Zuari Yoma Agri Solutions Limited (ZYASL): ZYASL is an associate of PPL, with expertise in high-tech agricultural solutions. ZYASL specializes in crop protection and digital agriculture, supplying farmers with the latest tools and products for efficient crop management. The company works on innovations in crop protection and promotes the use of environmentally friendly products. ZYASL supports Zuari’s expansion into advanced agri-tech solutions, helping meet the growing demand for modern agricultural products and services across various Indian regions.
These subsidiaries and joint ventures position Zuari Agro as a comprehensive agri-solutions provider, enhancing its market reach, product range, and production capabilities across India. Through strategic collaborations, Zuari is able to support sustainable farming practices, align with government agriculture policies, and address the diverse needs of the Indian agricultural sector.
Q2 FY25 Highlights
Revenue and Total Income: Revenue for Q2FY25 rose slightly to ₹1,123.32 crore from ₹1,096.65 crore in Q1FY25, reflecting a 2.4% increase. Total income also increased from ₹1,106.55 crore in Q1FY25 to ₹1,140.02 crore in Q2FY25, indicating mild growth. When comparing year-over-year, revenue in Q2FY25 dropped 31.9%, down from ₹1,648.97 crore in Q2FY24. Total income similarly declined from ₹1,672.10 crore in Q2FY24 to ₹1,140.02 crore in Q2FY25, likely due to market fluctuations or changes in demand. Although there was quarter-on-quarter growth, the significant year-over-year decline indicates revenue pressure.
EBITDA: EBITDA rose from ₹1,058.26 crore in Q1FY25 to ₹1,096.05 crore in Q2FY25, suggesting improved operational efficiency and cost management. However, compared to Q2FY24, EBITDA in Q2FY25 was significantly lower, down from ₹1,617.15 crore. This decline corresponds with the revenue drop, indicating that higher costs have impacted profit margins over the year.
Interest and Tax Expenses: Interest expenses decreased to ₹43.97 crore in Q2FY25 from ₹54.95 crore in Q2FY24, reflecting effective cost management and financing cost reductions. The interest cost also fell slightly from ₹48.29 crore in Q1FY25 to ₹43.97 crore in Q2FY25. Tax expenses also declined in Q2FY25 to ₹20.04 crore compared to ₹39.03 crore in Q2FY24, consistent with the lower profits. Reduced tax and interest expenses helped mitigate some of the effects of reduced revenue on profitability.
Profit After Tax (PAT) and Consolidated Profit: The PAT for Q2FY25 was ₹28.94 crore, close to ₹27.72 crore in Q1FY25, reflecting stable profit levels quarter-to-quarter. However, PAT dropped from ₹44.63 crore in Q2FY24 to ₹28.94 crore in Q2FY25 due to lower revenue and total income. Despite the PAT decline, consolidated profit in Q2FY25 increased to ₹81.23 crore from ₹35.49 crore in Q2FY24, largely due to contributions from associates. This growth from associate contributions in Q2FY25 positively impacted consolidated profit, providing some resilience to overall earnings.
Financial Summary
INR in Cr.
Q2FY25
Q1FY25
Q2FY24
Q-o-Q(%)
Y-o-Y(%)
Revenue
1,123.32
1,096.65
1,648.97
2.4%
-31.9%
Other Income
16.70
9.90
23.13
68.7%
-27.8%
Total Income
1,140.02
1,106.55
1,672.10
3.0%
-31.8%
Total Expenditure
1,022.15
978.50
1,510.18
4.5%
-32.3%
EBITDA
1,096.05
1,058.26
1,617.15
3.6%
-32.2%
Interest
43.97
48.29
54.95
-8.9%
-20.0%
Exceptional Items
PBDT
73.90
79.76
106.97
-7.3%
-30.9%
Depreciation
24.92
25.21
23.31
-1.2%
6.9%
PBT
48.98
54.55
83.66
-10.2%
-41.5%
Tax
20.04
26.83
39.03
-25.3%
-48.7%
Profit after Tax
28.94
27.72
44.63
4.4%
-35.2%
Minority Interest
-12.19
-20.21
-31.12
-39.7%
-60.8%
Share of Associate
64.48
1.65
21.98
3807.9%
193.4%
Consolidated Profit
81.23
9.16
35.49
786.8%
128.9%
Equity Capital
42.06
42.06
42.06
0.0%
0.0%
SWOT Analysis
Strengths
Established Brand with Strong Market Presence
Broad Product Range Catering to Various Segments
Integrated Manufacturing and Efficient Supply Chain
TVS Electronics Ltd. is a prominent Indian technology solutions provider within the TVS Group, focusing on electronic products and services catering to sectors like retail, banking, and e-governance. Established in 1986 and headquartered in Chennai, TVS Electronics has a strong market presence in India and is known for its wide range of offerings, from hardware manufacturing to after-sales services. The company operates in both B2B and B2C markets, consistently evolving to meet changing consumer and enterprise technology needs. Its service network, covering over 5,000 locations across India, makes it a preferred partner for companies requiring maintenance and repair solutions. The company also acts as a distributor and solution provider for IT peripherals and other electronic products. It has various big global and Indian clients Starbucks, Bharat Petroleum, Amazon, Dell, Acer, HP, Banks like SBI, ICICI, HDFC, etc. then Paytm, PhonePe, etc.
Industry Outlook
The Indian electronics industry is expected to grow at a CAGR of around 16-18% over the next decade, driven by strong domestic demand, robust government support, and increasing interest from global investors. The Indian electronics industry is one of the fastest-growing sectors in the country, driven by rising consumer demand, government initiatives, and foreign investments. India is rapidly evolving from an electronics import-dependent nation to a manufacturing hub, as demand for electronics continues to raise across various sectors, including consumer electronics, automotive, healthcare, and IT hardware. With a focus on both domestic consumption and exports, the industry is projected to see substantial growth in the coming years. India’s electronics demand is anticipated to reach approximately $400 billion by 2025, fuelled by increasing digitization, rising incomes, and a growing middle class. India’s electronic exports are increasing, with mobile phone exports alone reaching $11 billion in FY 2022-23. This trend is supported by the country’s participation in global value chains.
Financial Summary
INR Cr.
Q1 FY25
Q2 FY25
FY23
FY24
Revenue
111.32
104.61
353
366
EBITDA
3.16
2.63
20
10
OPM
2.84%
2.51%
6%
3%
PBT
-1.12
-1.49
13
-1
Net Profit
-1.26
-1.32
10
0
NPM
-1.13%
-1.26%
2.83%
0.01%
EPS
-0.68
-0.71
5.1
0.14
C&CE
5
7
11
4
Business Segments:
Products & Solutions: It is a core segment of TVS Electronics, it makes printers, cash machines, mobile handsets, keyboards are a major part, then provides software services also. It has clients in segments like retail, manufacturing, healthcare & hospitality, Banking and Financial services, IT, Audio, Solar companies and large government companies are also clients of this company. It also provides a one-stop solution service to its clients. It earned a revenue of ₹73.10 crore in this quarter.
Customer Support Services: In this segment, company offers after sales support services for many global and Indian clients. Provides field support to consumer electronics, solar customers, electric vehicles, etc. to make it seamless for the company’s clients. It also provides repair and management services for display panels, payment sound boxes and electronics. The in-house CRM platform integrates AI and machine learning capabilities to connect brands, service partners, parts management, and logistics seamlessly.
Q2 FY25 & Business Highlights
Revenue of ₹104.61 crore in Q2 FY25 up by 13.4% YoY from ₹92.19 crore in Q2 FY24.
EBITDA of ₹2.63 crore in this quarter at a margin of 2.51% compared to 4.18% in Q2 FY24.
Loss of ₹-1.32 crore in this quarter compared to a ₹1.12 crore profit in Q2 FY24.
The Product & Solution segment registered a YoY growth of 8.3% in revenue in Q2FY25 with revenue of ₹ 731 mn.
The customer support service vertical generated revenue of INR 315 Mn in Q2-FY25, representing an increase of 27.5% YoY and an increase of 15.8% on QoQ basis.
The top 10 customer concentration is reduced to 30% from 41% in FY20.
There was also an increase in finance costs on YoY basis, incurred for servicing the loans procured for capital investments and working capital requirements.
SWOT Analysis:
Strengths
Established Brand with Strong Legacy
Diverse Product Portfolio
Extensive Service Network Across India
Weaknesses
Highly Competitive Market Environment
Lower Profit Margins
Heavy Reliance on Domestic Market
Opportunities
Potential for New Product Line Expansions
Government Support for Local Manufacturing
Growing Demand for After-Sales and Support Services
Established in 1945 as Tata Engineering and Locomotive Co. Ltd, Tata Motors began as a locomotive manufacturer, unveiling its first steam road roller in 1948 and introducing medium commercial vehicles in collaboration with Daimler Benz by 1954. The company expanded rapidly, launching India’s first indigenous passenger car, the Tata Sierra, and diversifying into both light and heavy commercial vehicles. Tata Motors has built a strong global presence through key acquisitions, including South Korea’s Daewoo Commercial Vehicle in 2004 and Jaguar Land Rover (JLR) in 2008, marking its entry into the luxury market. Supported by research and design centers in India, the UK, Italy, and Korea, Tata Motors markets vehicles across Europe, Africa, South Asia, and Australia. Domestically, Tata Motors leads in the commercial vehicle market and holds a significant share in passenger vehicles, with products ranging from sub-1-ton trucks to 49-ton heavy-duty models, manufactured in multiple plants across India. Known for innovation, the company launched the Tata Nano, among the world’s most affordable cars, solidifying its reputation for durable and cost-effective vehicles.
Between 2017 and 2023, Tata Motors pioneered India’s electric vehicle (EV) market with the Tigor EV, later expanding its EV lineup with models like the Tiago EV and Tata Ace EV, the country’s first electric mini-truck. The launch of Tata Passenger Electric Mobility Limited (TPEML) in FY 2022-23, supported by a Rs. 7,500 crore investment from TPG Rise Climate, emphasized Tata’s commitment to an EV ecosystem. Product expansions included the new Safari and Punch (India’s first sub-compact SUV) in passenger vehicles, along with CNG variants of the Tiago and Tigor. In commercial vehicles, Tata Motors introduced India’s first CNG-powered Medium & Heavy Commercial Vehicle (M&HCV) and specialized models like the Yodha 2.0 and Intra series, catering to agriculture, logistics, and e-commerce sectors. Tata Motors also enhanced customer support by introducing a 6-year warranty on M&HCV trucks in 2018 and launched Tata Motors Genuine Oil to optimize commercial vehicle performance.
The company’s international reach has been bolstered by JLR subsidiaries in Europe, North America, and Asia, alongside strategic acquisitions like Spark44 Taiwan and Brabo Robotics, aligning with advanced automation and electric mobility. With investments of Rs. 36,636 Crores in FY 2019 and Rs. 31,222 Crores in FY 2020 for R&D and expansion, Tata Motors remains committed to sustainable, advanced automotive solutions. Today, it stands as a dynamic leader in the global automotive industry, propelling India’s mobility sector through innovation, sustainability, and quality vehicles that address diverse market needs.
Industry Outlook
The automobile industry in FY25 and beyond is poised for significant growth, largely driven by the shift to electric vehicles (EVs), a surge in demand for SUVs, and continued growth in commercial vehicles (CVs). The transition to EVs is central to the industry’s future, supported by sustainability goals, regulatory incentives, and advancements in EV technology. Government support through tax incentives, subsidies, and charging infrastructure is expected to accelerate the adoption of EVs globally, with India benefiting from initiatives like the FAME II scheme. Tata Motors, already a leader in India’s EV market, is well-positioned to capitalize on this shift.
Meanwhile, the SUV segment is expected to maintain robust growth, with an anticipated 8% year-on-year increase in demand as consumers continue to prefer larger, more versatile vehicles. Tata Motors’ emphasis on popular SUVs like the Safari and Punch is well-aligned with this trend. Similarly, the commercial vehicle segment—especially in medium and heavy commercial vehicles (M&HCVs)—will continue to thrive, driven by growth in sectors such as logistics, e-commerce, and construction, where Tata Motors maintains a strong presence. The company is also tapping into new opportunities with CNG-powered M&HCVs, ensuring its leadership in this sector.
The recovery of global supply chains, which were disrupted by the pandemic and geopolitical tensions, is another key factor in the industry’s future growth. Challenges like semiconductor shortages and raw material price hikes continue to affect production, but supply chain resilience is improving. This will enable Tata Motors to ramp up production in FY25 and meet the increasing demand, especially as the luxury vehicle market continues to grow. However, the company faces challenges in key markets like China, which has impacted Jaguar Land Rover (JLR)‘s performance.
Tata Motors has strategically positioned itself as a leader in both the passenger and commercial vehicle segments, while also leading the EV revolution in India. The company has invested heavily in Tata Passenger Electric Mobility Limited (TPEML), which recently secured a ₹7,500 crore investment from TPG Rise Climate. This positions Tata Motors to take full advantage of the EV sector’s growth potential, even as subsidy phases out over time.
In the luxury vehicle space, JLR, while facing challenges such as supply chain disruptions and a slowing Chinese market, continues to focus on high-performance and premium electric models. The company’s outlook remains positive, with an £30 billion revenue target and an EBIT margin of over 8.5%. JLR is also prioritizing its “House of Brands” strategy, which will elevate its luxury image and increase demand for its halo products.
Tata Motors’ global expansion via acquisitions like Jaguar Land Rover has strengthened its presence across Europe, North America, Asia, and Africa. However, the company remains mindful of ongoing supply chain challenges, including disruptions such as flooding at the Nivelles facility. Despite these challenges, Tata Motors is focused on building supply chain resilience to adapt to the evolving global market.
The broader automobile sector is recovering as consumer confidence returns post-pandemic. In both developed and emerging markets like India, vehicle demand is expected to rise, with the festive season traditionally boosting retail sales. Government policies and incentives will continue to drive the demand for sustainable mobility, particularly for energy-efficient vehicles, providing Tata Motors with an ideal environment for growth in FY25 and beyond.
Looking ahead, Tata Motors is focusing on consistent, cash-generating growth across its segments. In the commercial vehicle (CV) segment, Tata Motors aims to increase market share and improve realizations by focusing on innovation, service quality, and brand activation. In the passenger vehicle (PV) segment, the company will drive retail growth with new model launches, strengthen its dealer network, and focus on cost reduction to improve profitability in a competitive environment. For EVs, Tata will continue to mainstream EV adoption through targeted market development and ecosystem support, ensuring scalable profitability. The company’s goal is to enhance its position as a leader in the growing EV market and ultimately become net debt-free.
Business Segments
Tata Motors operates in several core business segments:
Passenger Vehicles (PV): The Passenger Vehicles (PV) segment at Tata Motors includes various passenger cars and utility vehicles, with a strong presence in India’s electric vehicle (EV) market, driven by models like the Nexon EV. Tata PV reported revenue of ₹11,700 crores in Q2 FY25, showing a 3.9% YoY decline, and ₹23,500 crores in H1 FY25, down 5.9% YoY. EBITDA margin for Q2 was at 6.2%, with the ICE segment at 8.5%, while the EV business posted a negative EBITDA but turned positive when excluding development expenses. Tata leads the EV market with a 67% share, supported by new launches like the Curvv and Nexon variants. Moving forward, Tata PV aims to drive retail growth with new model launches, inventory management, and a multi-powertrain strategy to stay competitive in this dynamic market.
Commercial Vehicles (CV): Tata Motors is a leading player in India’s commercial vehicle (CV) market, manufacturing a diverse lineup of trucks, buses, and light commercial vehicles that serve sectors such as logistics, mining, and construction. In Q2 FY25, the CV segment recorded revenue of ₹17,300 crores, marking a 13.9% YoY decline; for H1 FY25, revenue totalled ₹35,100 crores, down 5.2% YoY. Profitability improved slightly, with an EBITDA margin of 10.8% and a PBT of ₹1,300 crores. However, CV volumes dropped by 19.6% to 79,800 units, impacted by slower infrastructure project execution, reduced mining activity, and heavy rains. Growth in specific sub-segments, such as EV buses and ACE EV vehicles, along with orders from government entities, is expected to support a demand recovery. Tata Motors projects a gradual demand increase in H2 FY25, driven by infrastructure investments and festive season consumption.
Jaguar Land Rover (JLR): Jaguar Land Rover (JLR), acquired by Tata Motors in 2008, forms the luxury vehicle segment of the company with its renowned Jaguar and Land Rover brands. Aligning with sustainable mobility trends, JLR is actively expanding its EV and hybrid vehicle offerings. The segment reported revenue of approximately ₹65,000 crores in Q2 FY25, a 5.6% YoY decline. H1 FY25 revenue remained stable at around ₹1,37,000 crores. Profitability faced challenges this quarter, as EBITDA margin dropped to 11.7% (a decrease of 320 basis points), and EBIT stood at 5.1% (down by 220 basis points). Q2 PBT was approximately ₹3,980 crores, while H1 PBT grew 25% YoY, reaching around ₹10,910 crores. Temporary factors, including an aluminium supply shortage and quality checks on over 6,000 vehicles, impacted overall performance. However, production is expected to rebound in H2 FY25. Significant EV production investments have generated high interest, particularly in the new Range Rover Electric and upcoming Jaguar EV models. On the financial side, JLR maintained a liquidity position of ₹49,000 crores, including a recently refinanced revolving credit facility of ₹16,000 crores. These investments and liquidity measures are expected to support JLR’s continued innovation and growth in sustainable luxury vehicles.
Electric Mobility: As part of its sustainable strategy, Tata Motors is actively developing electric vehicle solutions across passenger and commercial segments. The company aims to expand EV adoption in India through its dedicated EV division, Tata Passenger Electric Mobility Limited.
Tata Motors Finance (TMF): Tata Motors Finance is the financial services arm of Tata Motors, offering vehicle financing and insurance services, mainly to support its PV and CV segments.
These segments collectively support Tata Motors’ mission to provide a range of mobility solutions and remain competitive in both domestic and international markets.
Key Subsidiaries and Their Information
Tata Motors’ key subsidiaries are driving growth and innovation across various automotive segments. Below are some of the key subsidiaries and their info:
Jaguar Land Rover (JLR): This luxury automotive subsidiary continues to lead Tata Motors’ global presence. JLR has seen strong revenue performance, especially in the North American and European markets. They are focusing on electric vehicles (EVs) with a mix of high-end offerings like the Range Rover and Defender, helping drive up retail and wholesale volumes. JLR also continues to improve profitability and reduce net debt.
Tata Passenger Electric Mobility Ltd (TPEML): Tata’s EV subsidiary is pivotal to its strategy for growth in the electric vehicle sector. With significant investment from TPG Rise Climate, TPEML is positioned to capture the growing demand for electric cars in India. The company’s EV portfolio includes models like the Tigor EV, Tiago EV, and Ace EV.
Tata Commercial Vehicles (CV): This arm focuses on strengthening Tata Motors’ leadership in the commercial vehicle market, especially in medium and heavy trucks. With innovations in CNG-powered vehicles and a strong presence in sectors like logistics and e-commerce, Tata CV is well-positioned to benefit from India’s infrastructure development.
Tata Technologies Ltd: A global leader in engineering and design services, Tata Technologies supports Tata Motors with advanced technologies and innovation, particularly in the development of electric vehicles and enhancing product offerings
Tata Motors’ key subsidiaries play a crucial role in driving the company’s strategy, focusing on growth in electric mobility, enhancing its luxury brands, and expanding its commercial vehicle sector. Tata Motors also strengthens its presence in key global markets like Europe, North America, and Africa through joint ventures and strategic partnerships. These efforts are aligned with Tata Motors’ broader strategy to lead in electric mobility, luxury vehicles, and the commercial vehicle market
Q2 FY25 Highlights
Tata Motors (TML) delivered a revenue of ₹101,500 crores for Q2 FY25, which marks a 3.5% decline YoY. The EBITDA was ₹11,600 crores, translating to a margin of 11.4%, which is a 230 basis points (bps) decrease compared to the previous year. EBIT was reported at ₹5,600 crores (5.6% margin), a 190 bps decrease YoY.
The PBT (before exceptional items) for Q2 stood at ₹5,800 crores, down ₹391 crores, and the net profit for the quarter was ₹3,500 crores. However, the company posted a strong performance in H1 FY25, with a PBT (bei) of ₹14,600 crores, reflecting an improvement of ₹2,900 crores compared to the previous year.
For Jaguar Land Rover (JLR), the revenue was down 5.6% YoY to £6.5 billion (approximately ₹62,500 crores based on current exchange rates). JLR’s performance was impacted by temporary supply constraints, resulting in a 220 bps drop in EBIT margin to 5.1%.
Tata Motors’ Commercial Vehicle (CV) revenues declined by 13.9%, but the EBITDA margin improved to 10.8% (up 40 bps) due to favorable pricing and material cost savings.
The Passenger Vehicle (PV) segment experienced a 3.9% revenue decline, but the EBITDA margin remained steady at 6.2% (down 30 bps) thanks to mix improvements and cost reduction efforts.
The company introduced the Nexon ICNG and 45 kWh models, which have received strong market reception. A groundbreaking ceremony for a new plant in Chennai highlights Tata’s ongoing commitment to expanding production capabilities.
The company is advancing toward its decarbonization roadmap, targeting net carbon zero by 2039 and ensuring a BEV derivative for all its brands by 2030.
Tata Motors maintains its leadership in the electric vehicle (EV) segment, with a dominant 67% market share in the personal EV segment.
Tata Motors Ltd. faced a challenging quarter, with a 3.5% decline in revenue, largely driven by supply chain disruptions and reduced demand across segments. The company also experienced challenges in its Jaguar Land Rover (JLR) division, where a flood at a key supplier led to production constraints, affecting the production of 86,000 units. Additionally, EBIT margins were impacted due to higher DNA charges and increased sales support expenses.
In the Chinese market, industry-wide discounting and overstocking created difficulties for Tata Motors, resulting in strained dealer networks and reduced sales.
The company’s commercial vehicle (CV) volumes declined by 19% year-on-year, influenced by external factors such as higher interest rates and reduced mining activities, which slowed demand for heavy vehicles.
Financial Summary
INR in Cr.
Q2FY25
Q1FY25
Q2FY24
Q-o-Q(%)
Y-o-Y(%)
Revenue from Operations
1,01,450
1,08,048
1,05,129
-6.1%
-3.5%
Other Income
1,566
1,575
1,630
-0.6%
-3.9%
Total Income
1,03,016
1,09,623
1,06,759
-6.0%
-3.5%
Expenses
89,291
92,263
91,362
-3.2%
-2.3%
Operating Profit
12,159
15,785
13,767
-23.0%
-11.7%
OPM (%)
12%
15%
13%
-20.0%
-7.7%
Finance Cost
2,034
2,088
2,652
-2.6%
-23.3%
Depreciation and Amortisation Expenses
6,005
6,574
6,637
-8.7%
-9.5%
Profit Before Tax (PBT)
5,767
8,870
6,035
-35.0%
-4.4%
Profit After Tax (PAT)
3,450
5,692
3,832
-39.4%
-10.0%
EPS
9.72
14.51
9.81
-33.0%
-0.9%
SWOT Analysis of Tata Motors
Strengths:
Strong Brand Portfolio & Market Position – Well-established reputation with a broad customer base.
Comprehensive EV Strategy – Aggressive push into the electric vehicle (EV) market, positioning for future growth.
Global Presence – Operating in diverse international markets, reducing reliance on any single region.
Diverse Product Portfolio – Wide range of vehicles, including passenger cars, commercial vehicles, and electric models.
Weaknesses:
Dependence on Jaguar Land Rover (JLR) – Heavy reliance on the performance of its premium brand division.
Impact of Supply Chain Disruptions – Ongoing challenges in sourcing components, particularly semiconductor shortages.
Profitability Pressures – High operating costs and fluctuating demand affect overall profitability.
Opportunities:
Expansion in the Electric Vehicle (EV) Market – Growing demand for EVs presents opportunities for further market share in the green vehicle segment.
Growth in Commercial Vehicle Market – Increasing demand for commercial vehicles, especially in emerging markets.
Global Expansion of JLR – Potential for continued growth through international markets and new model launches.
Government Support for EVs & Green Technologies – Favorable policies and incentives promoting the shift to sustainable transportation.
Threats:
Geopolitical & Economic Instability – Ongoing global uncertainty can affect operations and demand in key markets.
Intense Competition in EV & Commercial Vehicle Segments – Rising competition from both traditional automakers and new EV startups.
Declining Demand in Key Markets – Weakening demand in mature markets such as Europe and India could impact growth.
Supply Chain Vulnerabilities – Ongoing disruptions in global supply chains, particularly in sourcing critical components.
Oil India Ltd. (OIL) is one of the largest national oil and gas companies in India, primarily engaged in the exploration, development, and production of crude oil, natural gas, and liquefied petroleum gas (LPG). Founded in 1959 and headquartered in Duliajan, Assam, the company plays a crucial role in securing India’s energy needs through its significant contributions to domestic oil and gas production. It operates under the Ministry of Petroleum and Natural Gas and has international interests as well. OIL operates a large network of pipelines, including a 1,157-km trunk pipeline in the North East, which transports crude oil from Assam to various refineries. The company has reserves and production blocks across India, as well as strategic international assets in locations like Russia, Mozambique, and the United States.
Industry Outlook
The Indian oil and gas industry is poised for robust growth, fuelled by rising energy demands, government initiatives for energy security, and ongoing reforms aimed at modernising the sector. With India being one of the largest consumers of oil globally, the industry is a critical part of the country’s energy landscape. The country’s oil demand is projected to double by 2040, and natural gas demand is expected to grow by 4-5% annually over the next decade. The government’s target to reduce oil import dependence by 10% by 2022 and achieve 15% natural gas share in the energy mix by 2030 underscores the importance of boosting domestic production.
Business Mix
Crude Oil: The company has continued to improve its crude oil production, which is higher by 4.79% in quarter ended 30 September 2024, at 0.875 MMT from 0.835 MMT in the quarter ended 30 September 2023. Crude oil production has increased by 5.5% in half year ended 30 2024 at 1.746 MMT from 1.655 MMT in the half year ended 2023.
Natural Gas: The sale of natural gas during FY 2023-24 was 2521 MMSCM as compared to 2507 MMSCM during the previous year. The nation’s commitment is to increase the share of natural gas in the energy basket from the current level of 6% to 15% by 2030.
LPG: LPG Filling Plant was in operation for 292 days. Revenue earned by selling LPG during FY 2023-24 was ₹ 170.40 crores. Net realisation of condensate was ₹ 34.13 crores in the FY 2023–24 as against ` 52.15 crore in the previous year.
Pipeline: The crude oil pipeline transported 6.74 MMT of crude oil as against 6.79 MMT in the previous year. The company operates a total network of 1,243 km of crude oil pipeline.
Quarterly Highlights
Revenue of ₹7247 crore in Q2 FY25 is down by 3.33% YoY from ₹7497 crore in Q2 FY24.
EBITDA of ₹2536 crore in this quarter at a margin of 35% compared to 46% in Q2 FY24.
Profit of ₹2069 crore in this quarter compared to₹640 crore in Q2 FY24.
Business Highlights
Average crude oil price realization for Q2 FY25 is $79.33 per barrel and $86.86 per barrel for Q2 FY24, decreased by 8.67%.
Out of ₹28,000 crore capex, ₹1400 crore is for E&P business, and NRL has debt of ₹11,500 crore.
For City Gas Distribution (CGD) bids won for 9 areas and functioning are Kolhapur, Ambala, and Kurukshetra.
From April 2025, we will be getting a $0.25 premium over. So it would be averaging $6.75 this coming April.
Phase 1 for DNPL is adding 55 kilometres of new capacity, and after achieving it, Phase 2 will begin.
SWOT Analysis
Strengths:
Extensive Domestic Market Presence
Strong Government Backing
Well-Established Pipeline Infrastructure
Weaknesses:
Heavy Reliance on Crude Oil Prices
Outdated Infrastructure in Key Areas
High Operational Costs
Opportunities:
Rising Demand for Natural Gas
Expansions in Renewable Energy Initiatives
Supportive Government Policies
Potential for Strategic International Partnerships