Archives November 2024

Welspun Enterprises Q2 Results
Welspun Enterprises Q2FY25: Net Profit Declines 11% to ₹61.56 Crore

Company Overview

Welspun Enterprises Ltd, originally known as MSK Projects (India) Ltd, is an Indian company specializing in civil construction contracts and infrastructure projects. Founded on December 20, 1994, the company initially operated as a partnership under the name M.S. Khurana since 1976, before being rebranded as MSK Projects (India) Ltd in 1995. The company later went public in 2004 with an IPO, listing its shares on the BSE, NSE, and VSE. In 2010, it was renamed Welspun Projects Ltd and eventually became Welspun Enterprises Ltd.
Welspun Enterprises engages in a broad range of civil construction projects, such as residential townships, multi-story buildings, industrial plants, and infrastructure development. The company has executed large-scale industrial projects for sectors like petrochemicals, fertilizers, pharmaceuticals, and mining, primarily through Build-Operate-Transfer (BOT) models. It has also expanded into water distribution and surface transport projects, with a significant water supply project underway in Dewas, Madhya Pradesh.
Welspun Enterprises has formed strategic subsidiaries, including MSK Projects (Himatnagar Bypass) Pvt Ltd, Super Infrastructure & Toll Bridge Pvt Ltd, and MSK Projects (Kim Mandvi Corridor) Pvt Ltd, for infrastructure and toll projects. The company has secured notable contracts with Bharat Oman Refineries Ltd and Indian Oil Corporation for extensive civil and structural work across various pipeline and refinery projects.
In 2010, the company also diversified into the energy sector, marking a significant expansion into renewable energy by securing large-scale solar projects and establishing manufacturing facilities, including a 350,000 MTPA LSAW plant in Anjar, India, and an ERW plant in the United States. Welspun Enterprises is widely recognized for its work on the Delhi-Meerut Expressway project, underscoring its leadership in major infrastructure initiatives across India.

Industry Outlook

The Indian infrastructure sector is on a solid growth trajectory for FY25 and beyond, fueled by extensive government initiatives, increased private sector investments, and the demands of urbanization. Programs like PM Gati Shakti are catalyzing sector growth with ambitious projects, including the construction of 2 lakh km of national highways by 2025, along with expressways and urban infrastructure enhancements. The sector is anticipated to grow at a CAGR of 8-10% over the next five years, with highways projected to expand at over 10% annually. This growth extends to airports, ports, and railways, with high-impact projects such as the Delhi-Mumbai expressway and 12 new greenfield airports underway, boosting logistics efficiency and economic progress​.
In line with this growth, Welspun Enterprises Ltd. (WEL) is advancing its “Growth & Green” strategy through the DGT Project, which focuses on the collection, treatment, and repurposing of wastewater from Dharavi for reuse—an initiative underscoring sustainability and water reuse. WEL’s board recently approved an additional 9.99% stake in Welspun Michigan (WMEL), bringing ownership to over 60%. This acquisition supports a collaboration with Smart-Ops Water UK to introduce SABRE technology—a cutting-edge wastewater treatment process aimed at addressing untreated sewage in India.
With a consolidated order book of ₹15,200 crores and a rich pipeline of projects, Welspun Enterprises is positioned to drive execution and create long-term value across its verticals, capitalizing on the expanding infrastructure opportunities in India.

Business Segments

Welspun Enterprises Ltd operates primarily through two key business segments, contributing significantly to its overall portfolio.

  • Infrastructure: This segment focuses on the engineering, procurement, and construction (EPC) of infrastructure projects, particularly in roads, water supply, and urban development. The company engages in both Build-Operate-Transfer (BOT) and traditional EPC contracts. Some notable projects include the construction of major highways, rural water supply projects under the Jal Jeevan Mission, and various urban infrastructure initiatives. The infrastructure segment has seen robust growth, with sales reaching on TTM basis approx. to ₹32.27 billion in Q2FY25​. This segmentation has further diversifications such as water treatment, tunnelling, road constructions, etc.
  • Oil and Gas: In addition to infrastructure, Welspun Enterprises is involved in oil and gas exploration activities. This includes participation in the upstream oil and gas sector through a joint venture with Adani, focusing on a gas-based economy. The company also undertakes water transmission and distribution, alongside water and wastewater treatment services​.

The strategic focus of Welspun Enterprises on sustainable infrastructure development positions it well within India’s growing market, especially with government initiatives aimed at enhancing infrastructure across the nation. The company is actively participating in projects that address critical areas such as water management and urban development, which are pivotal for future growth​.

Key Subsidiaries and Their Information

Welspun Enterprises has several key subsidiaries that enhance its infrastructure portfolio. It also operates through various Associates and Joint Ventures.

  • Welspun Projects (Himmatnagar Bypass) Private Limited focuses on road infrastructure development, specifically the construction and management of bypasses to improve traffic flow.
  • Welspun Projects (Kim Mandvi Corridor) Private Limited is dedicated to developing vital highway corridors that enhance regional logistics.
  • Dewas Water projects Works Private Limited specializes in sustainable water supply infrastructure for urban areas, while
  • Welspun Buildtech Private Limited is involved in the construction of residential and commercial buildings.
  • Additionally, ARSS Bus Terminal Private Limited focuses on transportation infrastructure by developing bus terminals to improve public transport services.
  •  Grenoble Infrastructure Private Limited supports a wide range of urban and rural development projects.
  • DME Infra Private Limited works on diverse infrastructure projects across various sectors.
  • Welspun Sattanathapuram Nagapattinam Road Private Limited handles critical roadway construction and maintenance.
  • Welspun Aunta-Simaria Project Private Limited is engaged in project management, ensuring timely completion and quality oversight of construction projects.
  •  Welsteel Enterprises Private Limited supplies steel products and services for construction needs.
  •  Welspun – Kaveri Infraprojects JV collaborates on large-scale infrastructure initiatives.
  • Welspun EDAC JV Private Limited is involved in significant joint venture infrastructure projects, combining expertise from partners.
  • Welspun Michigan Engineers Limited provides engineering services and contributes to various construction projects, solidifying Welspun Enterprises’ capability to address multiple segments of the infrastructure market.

Q2 FY25 Highlights

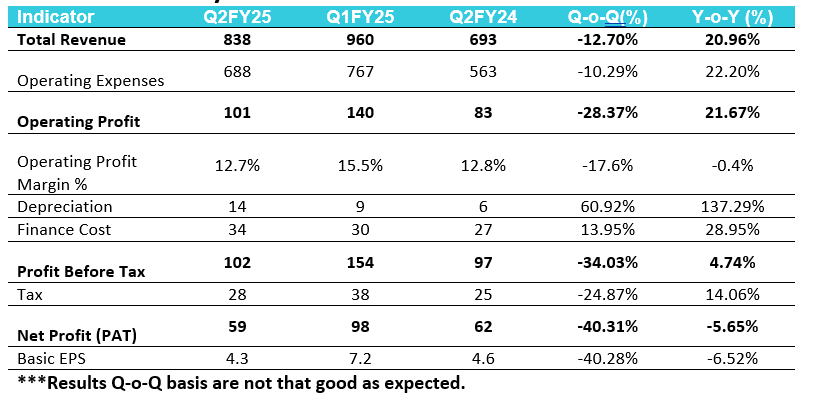
  • Revenue from operations surged by 22.1%, reaching ₹788.5 crore, compared to ₹645.7 crore in the same quarter last year. Total income increased to ₹837.92 crore from ₹692.65 crore year-over-year, while expenses rose to ₹736.33 crore from ₹595.61 crore. Highest-ever H1 Income of ₹ 1,798 Crores achieved in period ending September 2024.
  • The company’s EBITDA grew by 21.7%, totaling ₹100.5 crore, up from ₹82.6 crore in the previous year. However, the EBITDA margin slightly decreased to 12.7%, down from 12.8% year-on-year.
  • Consolidated net profit for the September quarter of FY25 fell by approximately 11% to ₹61.56 crore, primarily due to higher expenses. Abhishek Chaudhary has been appointed as the new Chief Executive Officer (CEO), effective November 4, 2024.
  • The consolidated order book of the company stood at ₹15,200 crore at the end of September 2024.
  • The board approved the acquisition of an additional 9.99% stake in Welspun Michigan from Patel Engineering for around ₹100 crore.
  • Welspun Enterprises secured a significant design and build contract worth ₹1,989 crore from the Brihanmumbai Municipal Corporation (BMC). This contract involves designing and constructing a tertiary treated water conveyance tunnel from the Dharavi Wastewater Treatment Facility to the Ghatkopar WWTF.

Financial Summary

SWOT Analysis

Strengths:

  1. Diverse portfolio of projects.
  2. Strong financial backing.
  3. Proven expertise in infrastructure development.
  4. Robust order book with ongoing contracts.

Weaknesses:

  1. High capital expenditure leading to increased debt.
  2. Dependence on government contracts for revenue.
  3. Limited international presence.
  4. Risk of project delays.

Opportunities:

  1. Growing infrastructure sector in India.
  2. Potential for public-private partnerships (PPP).
  3. Expansion into renewable energy projects.
  4. Adoption of technological advancements in project execution.

Threats:

  1. Intense competition in the infrastructure space.
  2. Challenges related to regulatory and environmental compliance.
  3. Rising input costs affecting profitability.
  4. Economic slowdowns impacting project viability.

Vedant Fashions Reports 37% YoY PAT Growth in Q2
Vedant Fashions Reports 37% YoY PAT Growth in Q2, Reaching ₹67 Crore

Company Overview

Vedant Fashions Ltd. is one of India’s leading ethnic wear companies, best known for its flagship brand Manyavar, catering to wedding and celebration wear for men, women, and children. Founded in 2002 and headquartered in Kolkata, Vedant Fashions has grown into a prominent player in India’s organized ethnic wear market, capitalizing on the strong cultural affinity for traditional clothing. The company has a widespread retail network with over 500 exclusive brand outlets across 200+ cities in India. Additionally, Vedant Fashions has expanded internationally, with stores in the USA, UAE, and Canada.

Industry Outlook

The Indian ethnic fashion industry is poised for steady growth, driven by increasing disposable incomes, cultural trends, and a growing preference for branded and organized ethnic wear. The Indian ethnic wear market is expected to grow at a CAGR of around 10% over the next five years, driven by demand for wedding and festival attire. By 2025, the market is projected to reach approximately $20 billion, fuelled by a mix of traditional festivals, weddings, and family celebrations. Additionally, there is rising interest in region-specific attire, which showcases local craftsmanship and heritage.

Segment Information

  • Men’s Ethnic Wear: In this segment brands like Manyavar and Twamev are involved to cater a men’s wear segment.
  • Women’s Ethnic Wear: For women wear, in this portfolio Mohey brand makes exclusive for wedding and festive wear for women.
  • Affordable Wear: To cater for young generations and customers with low price capacity this segment includes Manthan in its portfolio.
  • Regional & Multi-Cultural Wear: To provide for cultural preference this segment includes Mebaz in its portfolio collections.

Brands

  • Manyavar: Manyavar is their flagship brand contributing major in the revenue of Vedant Fashions. It is into the Men’s and Boy’s shopping categories, at mid-premium spectrum. It is sold through Exclusive Brand Outlet (EBO), Multi Brand Outlet (MBO) and E-commerce.
  • Mohey: Mohey is a brand focused on women’s wedding & festive attire, including Lehengas, sarees, gowns and suits.
  • Twamev: It is a premium brand that caters to high-end customers with luxury wedding and celebrations wear.
  • Manthan: It is an affordable men’s ethnic wear, designed to capture the growing demand among young age populations and price. sensitivecustomers.
  • Mebaz: This brand specifically caters to South Indian and multicultural preferences. It is for men, women, and children’s wedding and festive wear.

Quarterly Highlights

  • Revenue of Rs 267.9 crore in this quarter, up by 22.7% YoY.
  • EBITDA of Rs 121.7 crore up by 27.5% YoY from Rs 95.4 crore in Q2 FY24. At EBITDA margin of 45.4% in Q2.
  • Profit is Rs 66.9 crore up by 37.3% YoY from Rs 48.7 crore in Q2 FY24. At PAT margin of 25% in Q2.

Business Highlights

  • The company has successfully launched a new festive and celebration wear brand Diwas.
  • A new EBO of 4.7k area is rolling out in Q2 FY25.
  • Jahnvi Kapoor is onboarded as a new brand ambassador for its women’s wear brand ‘Mohey’.
  • Vedant Fashions has no borrowings on its balance sheet; it’s a lease liability, which is money taken in advance for a contract.

Financial Summary and Key Ratios

SWOT Analysis

Strengths:

  • Diverse brand portfolio
  • Strong brand recognition
  • Focus on premium segment
  • Extensive retail network

Weaknesses:

  • Seasonal demand fluctuations
  • High pricing limits reach
  • Limited to ethnic wear

Opportunities:

  • Growing digital presence
  • Celebrity endorsements
  • Focus on regional and cultural apparel

Threats:

  • Changing fashion trends
  • Intense competition
  • Economic downturns impacting spending

HDFC Bank Q2 Results
HDFC Bank Q2 Results: Net Profit Up 5.3% to ₹16,821 Crore; NII Rises 10% Year-Over-Year Amid Declining Asset Quality

Company Overview

HDFC Bank Limited (also known as HDFC) is an Indian banking and financial services company headquartered in Mumbai. It is India’s largest private sector bank by assets and the world’s tenth-largest bank by market capitalization. The company is India’s one of 3 systemically important banks with a 15% market share in the banking sector’s advances and a 37% market share in the private sector banks’ advances as of FY24. It is also the second-largest bank in India. The Bank has a distribution network of 8,851 branches and 21,163 ATMs across 4,081 cities.

Industry Outlook

Indian banks are witnessing a resurgence in credit demand, driven by growth across retail, MSME (Micro, Small, and Medium Enterprises), and corporate segments. Credit growth is expected to be 10-12% in FY25, fuelled by increased consumption, infrastructure spending, and recovery in sectors like real estate and manufacturing. NPAs expected to decline to around 4% in FY25. Enhanced risk management practices, improved loan recovery rates, and a healthier economic environment are contributing to better asset quality, which is likely to support profitability. The Reserve Bank of India (RBI) is focused on strengthening the banking sector through regulations around capital adequacy, governance, and digital banking frameworks.

Segmental Information

  • Wholesale Banking: The Wholesale Banking Business of HDFC Bank serves a diverse clientele including Large Corporates, Multinational Corporations, Government, Public Sector Enterprises, Emerging Corporates and Business Banking/SMEs. Offering a wide array of financial products and services such as loans, deposits, payments, collections, tax solutions, trade finance, cash management solutions and corporate cards, etc. This business largely covers the rental discounting business as well as construction finance.
  • Retail Banking: HDFC Bank’s Retail Business caters to a varied client base which includes Individuals, salaried professionals, small businesses like kirana stores, and Non-Resident Indians (NRIs). Among the offerings are Savings and Current Accounts, various loan options for personal and business needs, Credit and Debit Cards, Digital Wallets, Insurance and Investment Products and Remittance Services.
  • Treasury: The Treasury department is responsible for managing the Bank’s liquidity requirements, as well as handling its investments in securities and other market instruments. It manages the balance sheet’s liquidity and interest rate risks and ensures compliance with statutory reserve requirements. It also manages the treasury needs of customers and earns a fee income generated from transactions customers undertake with your Bank, while managing their foreign exchange and interest rate risks.

Quarterly Highlights

  • Revenue for Q2 FY25 is Rs 74,017 compared to Rs 67,698 crore in Q2 FY24.
  • Financing profit of Rs 10523 crore in this quarter, with the margin of 14%.
  • Net Profit is Rs 16821 crore in Q2 up from Rs 15,976 crore in Q2 FY24.

Operational Highlights

  • Average Deposits in Q2 were Rs 23,540 bn up by 15.5% YoY, growth in Advances under management is 10.2% YoY to Rs 25,639 bn. The fee income is around Rs 8000 crore for Q2.
  • Retail/Wholesale deposits are 84% & 16% respectively for Q2 FY25. And the CASA deposits are Rs 2754 bn for Current Accounts, Rs 6081 bn for Savings Accounts and the CASA ratio is 35% for Q2 FY25.
  • Branch network in Q2 is of 9092 branches, of which Semi-Urban has highest branches accounting for 34%.
  • The Net revenue mix is 72% for Net Interest Income and 28% for Non-Interest Income, and this proportion has steady.
  • The Yield on Assets are 8.3% and cost of funds are 4.9%. Their difference shows us the earnings of bank through lending it to retail. Lower the cost, higher the profit margin in lending.

Financial Summary and Key Ratios

SWOT Analysis

Strengths:

  1. Strong asset quality
  2. Extensive branch network
  3. Market leadership position

Weaknesses:

  1. High reliance on retail loans
  2. Elevated valuations
  3. Regulatory pressures

Opportunities:

  1. Growth potential in SME and MSME lending
  2. Expansion of wealth management services
  3. Increasing financial inclusion

Threats:

  1. Intense competition
  2. Risk of economic slowdown
  3. Cybersecurity threats
sbi cards & payment services ltd. q2 results
SBI Card Q2 Results: Profit After Tax Falls 33% to Rs 404 Crore Amid Rising Bad Loan Provisions

Company Overview

Incorporated as a private limited company in New Delhi on May 15, 1998, SBI Cards and Payment Services Limited is a prominent subsidiary of the State Bank of India (SBI) and became a public limited company in August 2019. It specializes in issuing credit cards and functions as a corporate insurance agent, offering policies to cardholders. Currently, it is the second-largest credit card issuer in India, managing over 1.79 crore active credit cards. Since its inception, SBI Cards has leveraged SBI’s trusted brand to become a reliable provider of diverse credit card products, supporting cashless and digital transactions in India. The company’s growth has been notable, achieving higher-than-market expansion in terms of credit card numbers and spend. Between March 2017 and March 2019, its credit card spends grew at a CAGR of 54.2%, outpacing the overall industry’s growth. This success is attributed to India’s economic and demographic trends, such as rising incomes, increasing consumer demand, and e-commerce expansion.
With a robust customer acquisition network, SBI Cards utilizes over 32,000 outsourced sales personnel in 145 cities, operating through physical outlets and digital channels, including its website and mobile app. SBI Cards also benefits from SBI’s network, accessing its vast customer base via 21,961 branches, enhancing its reach. SBI Cards has established a robust position in India’s credit card market by diversifying its products, expanding partnerships, and leveraging SBI’s brand and network. The company’s forward momentum continues with its focus on digital expansion and innovative offerings tailored to India’s evolving consumer needs.

Industry Outlook

India’s credit card industry is experiencing rapid growth, driven by digital adoption, increased consumer spending, and favourable economic conditions. The value of credit card transactions is expected to reach INR 51.72 trillion by FY 2027, growing at a CAGR of 39.22% since FY 2022, while transaction volumes are anticipated to grow at a CAGR of 26.43%. This growth aligns with a broader shift toward cashless payments, supported by rising incomes, urbanization, and the integration of digital financial services.
Technological advancements like fintech innovations, co-branded cards, and improved digital infrastructure—particularly Unified Payments Interface (UPI) and contactless payment technology—are further encouraging credit card adoption. Although digital wallets and UPI present strong competition, credit cards maintain a unique advantage with benefits such as reward programs and EMI options, appealing to consumers seeking flexible credit.
SBI Cards is well-positioned to capitalize on these trends, focusing on expanding its RuPay network for UPI-linked credit transactions, which now make up approximately 10% of its card portfolio. Additionally, it is leveraging partnerships, launching new products, and utilizing a broad customer acquisition network across digital and physical channels. This approach aligns SBI Cards with shifting demographics and rising demand for credit services, solidifying its position in the expanding credit card market.

Business Segments

SBI Cards and Payment Services operates primarily in two business
Segments.

Credit Card Issuance: The core of SBI Cards’ business involves issuing credit cards tailored to a diverse customer base, from first-time users to premium customers. This segment offers value-added products ranging from lifestyle and cashback cards to co-branded options with partners across industries like travel, fuel, and retail. The company continues to expand its digital footprint and strengthen partnerships with networks such as RuPay for UPI credit transactions, aiming to adapt to the evolving digital payment landscape.

Corporate Insurance Agency Services: SBI Cards also serves as a corporate insurance agent, providing policies to cardholders. Although a smaller segment compared to credit card services, it offers a complementary revenue stream by cross-selling insurance products, such as health and accident coverage, tailored to cardholders’ needs.

• These segments allow SBI Cards to capture a broader customer base through a mix of financial and insurance services, supporting its growth strategy in India’s expanding credit market

Key Subsidiaries and Their Information

SBI Cards and Payment Services Limited, a subsidiary of the State Bank of India (SBI), specializes in credit card services across India, serving both individual and corporate clients. Benefiting from SBI’s broad network and strong brand presence, SBI Cards has access to a large customer base, allowing it to deliver customized credit card solutions for a range of needs.

For individual users, SBI Cards offers a variety of retail credit cards, including co-branded cards in partnership with brands like IRCTC and Tata. These co-branded options provide customers with targeted rewards, such as travel benefits and retail discounts, which appeal to various spending preferences.

In the corporate segment, SBI Cards supports businesses with business credit cards designed to manage expenses efficiently. These corporate cards come with features such as customizable credit limits, travel perks, and expense tracking tools, making them highly suitable for companies with frequent business-related spending.

Q2 FY25 Highlights

  • Total Revenue increased by 8% year-over-year to ₹4,556 crore from ₹4,221 crore in Q2 FY24, indicating a stable expansion in revenue streams, possibly due to higher transaction volumes and credit card adoption.
  • Profit After Tax (PAT) declined sharply, falling to ₹404 crore from ₹603 crore in Q2 FY24, suggesting higher operational or credit-related costs.
  • Return on Average Assets (ROAA) decreased to 2.7% from 4.9% in the previous year, while Return on Average Equity (ROAE) dropped to 12.5% from 22.3%, pointing to reduced profitability and efficiency in asset and equity returns.
  • Capital Adequacy Ratio (CAR) remains robust at 22.1%, with Tier 1 at 16.3%, ensuring compliance with regulatory standards and providing a cushion for credit risk.
  • Cards-in-Force saw a 10% YoY growth, reaching 1.96 crore as of Q2 FY25 compared to 1.79 crore in Q2 FY24, indicating successful customer acquisition and retention.
  • Market Share for Cards-in-Force stands at 18.5% (down from 19.2%) and for spending at 15.7% (down from 18.0%), yet SBI Cards holds its position as 2nd in Cards-in-Force and 3rd in spending across the industry.
  • Credit Card Receivables grew by 23% YoY to ₹55,601 crore in Q2 FY25 from ₹45,078 crore in Q2 FY24, indicating increased credit usage or delayed repayments.
  • Customer Spending rose by 3% YoY, reaching ₹81,893 crore versus ₹79,164 crore in the previous year, showing stable customer spending despite modest growth influenced by economic conditions.

Financial Summary

INR in Cr.Q2FY25Q1FY25Q2FY24Q-o-Q(%)Y-o-Y(%)
Interest Income                        2,290       2,243       1,9022.10%20.40%
Non-Interest Income
(Fees, Commission Income & Others)
                        2,131       2,115       2,1860.76%-2.52%
Total Revenue from Operations                        4,421       4,359       4,0871.42%8.17%
Total Other Income                           135          124          1348.87%0.75%
Total Income                        4,556       4,483       4,2211.63%7.94%
Finance Costs                           788          767          6052.74%30.25%
Operating Costs                        2,011       1,816       2,06610.74%-2.66%
Earnings before credit costs                        1,757       1,900       1,551-7.53%13.28%
Impairment Losses & Bad Debts                        1,212       1,101          74210.08%63.34%
Profit Before Tax                           545          799          809-31.79%-32.63%
Profit After Tax                           404          594          603-31.99%-33.00%
EPS(Diluted)                          4.25         6.25         6.35-32.00%-33.07%

SWOT Analysis

Strengths:

  1. Strong brand recognition
  2. Wide range of product offerings
  3. Significant market share
  4. Extensive digital and physical presence

Weaknesses:

  1. Reliance on SBI’s network
  2. Focus primarily on urban markets
  3. High operating expenses
  4. Limited international presence

Opportunities:

  1. Expanding digital economy
  2. Potential for product and service innovation
  3. Increasing consumer spending
  4. Opportunities for partnerships and alliances

Threats:

  1. Regulatory hurdles
  2. Cybersecurity vulnerabilities
  3. Credit risk exposure
  4. Economic downturns