Archives February 2025

SBI Q3 FY25 Results
SBI Q3 FY25 Results: Strong Net Profit Jumps 83% YoY

State Bank of India Ltd: Overview 

State Bank of India (SBI), established in 1955, is India’s largest public sector bank, with a rich legacy tracing back to the Bank of Calcutta in 1806. Headquartered in Mumbai, SBI operates an extensive network of over 22,405 branches across India and 235 offices in 29 countries, serving more than 45 crore customers. The bank offers a comprehensive range of financial services, including retail and corporate banking, investment banking, asset management, and insurance. SBI’s commitment to technological innovation is evident in its digital platforms like YONO (You Only Need One), which integrates various financial services into a single mobile application, enhancing customer convenience and engagement. The Indian banking industry is experiencing significant transformation, driven by technological advancements, regulatory reforms, and evolving customer expectations. Public sector banks like SBI are pivotal in promoting financial inclusion, especially in rural and semi-urban areas. The sector is witnessing increased competition from private banks and fintech companies, necessitating continuous innovation and customer-centric strategies. Despite challenges such as non-performing assets and economic fluctuations, the outlook for the Indian banking industry remains positive, with opportunities arising from economic growth, infrastructure development, and a burgeoning middle class. 

Latest Stock News 

SBI has maintained its strong position in the domestic banking sector with a sustained market share of over 22%, driven by its extensive reach, customer trust, and value-added services. The bank’s current account balances witnessed a robust growth of 14.22% year-on-year, while total deposits surpassed ₹52 lakh crore, reflecting strong customer confidence. Domestic credit growth stood at 14.06% year-on-year, with significant expansion across various business segments. Whole Bank Advances crossed ₹40 lakh crore, supported by broad-based credit growth exceeding the market average, with the domestic credit-to-deposit ratio at 68.94%. SBI continues to demonstrate industry-leading asset quality, with a credit cost of just 0.24% for the quarter. The stressed book remains well provided for, with a provision coverage ratio (PCR) of 74.66%. Net Non-Performing Assets (NPA) stood at ₹21,378 crore, with additional provisions of ₹29,757 crore that are not included in the PCR, further strengthening the bank’s financial stability. The bank has also made significant strides in digital banking, with over 98% of transactions being conducted through alternate channels. The YONO platform continues to be a key growth driver, accounting for 64% of new savings accounts opened in Q3FY25 and boasting 8.45 crore registered customers. Customer credit has crossed the ₹6 trillion milestones for the first time, with gross advances growing by 10.35% year-on-year. Key international branches, including those in New York, GIFT City, Singapore, DIFC Dubai, and Hong Kong, have significantly contributed to this growth. Additionally, SBI has improved its asset quality, with the gross NPA ratio declining by 9 basis points year-on-year, reflecting its commitment to maintaining financial resilience and sustainable growth. 

Business Segments 

  • Retail Banking: This segment caters to individual customers, offering products like savings and current accounts, personal loans, home loans, and credit cards. SBI’s extensive branch network and digital platforms facilitate widespread access to banking services across urban and rural areas. 
  • Corporate Banking: SBI provides a range of services to corporate clients, including working capital finance, term loans, cash management, and trade finance. The bank supports large, mid-sized, and small enterprises, contributing significantly to industrial and economic development. 
  • Treasury Operations: This segment manages the bank’s investments in government and corporate securities, money market operations, and foreign exchange activities. Effective treasury management enhances SBI’s profitability and liquidity position. 

Subsidiary Information 

  • SBI Capital Markets Limited (SBICAPS): SBI Capital Markets Limited (SBICAPS) is a wholly-owned subsidiary of the State Bank of India, established in 1986, with a primary focus on providing investment banking and corporate advisory services. SBICAPS plays a critical role in advising large corporate, government entities, and financial institutions on mergers and acquisitions, capital raising, and financial restructuring.  
  • SBI DFHI Limited: SBI DFHI Limited is another key subsidiary of the State Bank of India, formed through the merger of Discount & Finance House of India and SBI Gilts Ltd. This entity serves as a primary dealer in the domestic debt market, handling a wide range of financial instruments, including government securities, treasury bills, and money market instruments. SBI DFHI remains a key player in India’s financial markets, supporting the stability and growth of the country’s debt capital market. 
  • SBI Global Factors Limited: SBI Global Factors Limited is a financial services subsidiary of the State Bank of India that specializes in factoring services, offering working capital solutions to businesses through the purchase of receivables. The company plays a crucial role in enabling businesses to improve their cash flow by converting credit sales into instant funds, thus ensuring smooth operational liquidity. 
  • SBI Life Insurance Company Limited: SBI Life Insurance Company Limited is a prominent joint venture between the State Bank of India and BNP Paribas Cardif, focusing on providing a comprehensive range of life insurance products. With a strong distribution network across India, SBI Life has been a key player in the life insurance sector, offering products such as term insurance, endowment plans, pension schemes, and unit-linked insurance plans (ULIPs). 
  • SBI Cards and Payment Services Limited: SBI Cards and Payment Services Limited is a key subsidiary of the State Bank of India, focusing on the issuance of credit cards and providing payment solutions to millions of customers. As one of India’s leading credit card issuers, SBI Cards offers a wide range of credit card products tailored to different consumer segments. With the rapid adoption of digital transactions in India, SBI Cards has seen significant growth in its customer base and transaction volumes. 

Q3 FY25 Earnings 

  • Revenue of ₹124654 crore in Q3 FY25 up by 10.4% YoY from ₹112868 crore in Q3 FY24.  
  • Financing Loss of ₹-17643 crore in this quarter at a margin of -14% compared to -16% in Q3 FY24. 
  • Profit of ₹19484 crore in this quarter compared to a ₹11598 crore profit in Q3 FY24. 

Financial Summary 

Amount in ₹ Cr Q3 FY24 Q3 FY25 FY23 FY24 
Revenue 112868 124654 350848 439189 
Interest  68092 77397 189981 259736 
Expenses 62653 64890 204303 239750 
Financing Profit -17858 -17634 -43439 -60297 
Financing Margin -16% -14% 12% 14% 
Other Income 33103 43200 122534 155386 
Net Profit 11598 19484 57750 69543 
NPM 10.2% 15.6% 16.4% 15.8% 
EPS 12.4 21.2 62.4 75.2 
Swiggy Ltd Q3 Reports
Swiggy Ltd Results: Net Loss Widens to ₹799 Crore, Revenue Up 31% in Q3

Swiggy LtdOverview 

Swiggy Limited, established in 2014 and headquartered in Bangalore, India, has evolved into a leading consumer technology company specializing in on-demand services. Initially focusing on food delivery, Swiggy has diversified its offerings to include quick commerce through Instamart, dining out experiences via Dineout, and hyperlocal services like Swiggy Genie. Operating in over 600 cities across India, the company has built a vast network of restaurant partners and delivery personnel, aiming to provide seamless convenience to its users. Swiggy’s platform is accessible through a unified application, allowing customers to browse, select, order, and pay for a variety of services, thereby enhancing the urban consumer experience. The Indian on-demand delivery industry is experiencing rapid growth, driven by increasing urbanization, rising disposable incomes, and a growing preference for convenience among consumers. The food delivery segment, in particular, has seen significant expansion, with companies like Swiggy and its competitors vying for market share. Additionally, the quick commerce sector, which focuses on the rapid delivery of groceries and household items, is gaining momentum. Swiggy’s Instamart service has capitalized on this trend, contributing to the company’s diversified revenue streams. However, the industry is highly competitive, with players investing heavily in technology, logistics, and customer acquisition to maintain and grow their market positions. Regulatory challenges and the need for sustainable business models also play crucial roles in shaping the industry’s future. 

Latest Stock News 

Swiggy’s platform witnessed significant growth, with the Platform Average Monthly Transacting Users (MTU) rising by 25.3% year-over-year (YoY) to reach 17.8 million. The food delivery segment recorded a Gross Order Value (GOV) growth of 19.2% YoY (3.4% quarter-over-quarter), amounting to ₹7,436 crore. Over the past year, Swiggy added 2.4 million new Monthly Transacting Users, bringing the total to 14.9 million. In the quick-commerce segment, Swiggy achieved an impressive GOV growth of 88.1% YoY (15.5% QoQ), reaching ₹3,907 crore, driven by a 13.9% QoQ increase in MTUs. The average order value continued to expand, reaching ₹534. Swiggy also ventured into 10-minute food delivery with the launch of Bolt in early October 2024, offering consumers access to a wide range of restaurants with delivery times of 10-15 minutes. Metropolitan areas played a crucial role in Swiggy’s growth, with over 70% of its stores in Q3 FY25 located in metros, which contributed to more than 80% of the platform’s total GOV. The company accelerated store additions, with 86 new stores established in January 2025 alone, keeping it on track to achieve its goal of a 4 million sq. ft. active dark store footprint by March 2025. Swiggy maintained a strong financial position with ₹8,183 crore in cash and cash equivalents as of December 31, 2024. To further enhance customer value, Swiggy introduced One BLCK, the premium tier of its horizontal loyalty program Swiggy One, aimed at elevating customer engagement and retention. 

Business Segments

  • Food Delivery: This is Swiggy’s core segment, offering on-demand food delivery services by partnering with a wide array of restaurants. Customers can order meals through Swiggy’s user-friendly app or website, with a focus on timely deliveries and diverse cuisine options. As of June 2024, Swiggy was present in 681 cities, highlighting its extensive reach in the food delivery market.  
  • Quick Commerce (Instamart): Launched to meet the growing demand for rapid grocery and household item deliveries, Instamart offers a wide selection of products delivered swiftly to customers’ doorsteps. This segment has seen substantial growth, with Swiggy expanding its network of dark stores to enhance delivery efficiency. As of October 2024, Swiggy operated 538 warehouses, averaging 4,000 square feet each, to support its quick commerce operations.  
  • Dineout and Events: Through the acquisition of Dineout, Swiggy has entered the dining out and events space, allowing users to make restaurant reservations and access curated events. This segment enhances Swiggy’s service portfolio by catering to customers seeking dining experiences outside their homes. As of June 2024, this service was available in 52 cities.  
  • Supply Chain and Distribution: Swiggy offers supply chain services to wholesalers, retailers, and fast-moving consumer goods (FMCG) brands, leveraging its warehousing capabilities to streamline logistics and distribution. This segment supports Swiggy’s quick commerce operations and provides value-added services to its partners. 

Subsidiary Information

  • Dineout: In 2022, Swiggy acquired Dineout, a prominent dining and table reservation platform, from Times Internet in an all-stock deal valued at approximately $120 million. Dineout enables users to discover restaurants, access menus and images, make reservations, avail attractive promotions, and process digital payments. This acquisition allowed Swiggy to strengthen its position in the dining-out segment. 
  • Lynk Logistics: In July 2023, Swiggy acquired Lynk Logistics, a company specializing in the organization and transportation of goods, as well as the development of systems to manage such logistics. Lynk provides a platform facilitating transportation services, thereby enhancing Swiggy’s capabilities in supply chain management and distribution.  
  • Swiggy Sports Private Limited: In January 2025, Swiggy received approval from the Ministry of Corporate Affairs to incorporate Swiggy Sports Private Limited, a wholly-owned subsidiary dedicated to sports and recreational activities. The objectives of this new entity include engaging in sports team ownership and management, talent development, event organization, facility operation, offering career services, acquiring broadcasting and sponsorship rights, and promoting sports events through various business models. 

Q3 FY25 Earnings 

  • Revenue of ₹3993 crore in Q3 FY25 up by 30.9% YoY from ₹3049 crore in Q3 FY24.  
  • EBITDA of ₹-726 crore in this quarter at a margin of -18% compared to -17% in Q3 FY24. 
  • Profit of ₹-799 crore in this quarter compared to a ₹-574 crore profit in Q3 FY24. 

Financial Summary 

Amount in ₹ Cr Q3 FY24 Q3 FY25 FY23 FY24 
Revenue 3049 3993 8265 11247 
Expenses 3575 4719 12538 13447 
EBITDA -526 -726 -4278 -2199 
OPM -17% -18% -52% -20% 
Other Income 78 106 438 341 
Net Profit -574 -799 -4179 -2350 
NPM -18.8% -20% -50.5% -20.9% 
EPS – -3.57 – – 

Info Edge Q3 Reports
Info Edge Reports 2.5X Profit Surge with ₹722 Cr Revenue in Q3 FY25: Key Highlights

Business and Industry Overview

Info Edge is widely recognized for its strategic investments in promising internet-based businesses. With years of experience and a diversified portfolio, it is one of India’s most profitable pure-play internet companies. Founded in 1995 and publicly listed in 2006, Info Edge operates a network of 62 offices in 43 cities across India and employs 5,883 individuals. These employees are engaged in various functions, including innovation, product development, mobile and social media integration, technology updates, research and development, quality assurance, sales, marketing, and payment collection. Info Edge also has a significant presence in the Gulf market with its website, www.naukrigulf.com, and maintains offices in Dubai, Bahrain, Riyadh, and Abu Dhabi. 

With the increasing consumption of the internet, the demand for internet-based services has grown significantly. The outbreak of the COVID-19 pandemic has further accelerated the expansion of this industry. Currently, India is the second-largest internet market in the world, and the number of internet users is projected to exceed 1.3 billion by 2030. The growth of digital infrastructure has also played a crucial role in the rise of the consumer internet industry in India, which is now home to over 2,464 unique funded consumer internet startups. The startup landscape continues to expand across various sectors, including e-commerce, fintech, edtech, health tech, consumer services, media and entertainment, travel tech, and transport tech. Investors are increasingly focused on large consumer internet startups, as it is a booming sector. Info Edge has strategically positioned itself within the industry, with its presence spanning recruitment (naukri.com, naukrigulf.com, firstnaukri.com, real estate (99acres.com), matrimony (jeevansathi.com), and education (shiksha.com). 

Latest Stock News

Info Edge continues to strengthen its position in the consumer internet industry through strategic investments across diversified market segments. In a significant development, the company’s board approved a stock split during its recent meeting on February 5, 2025. As per the regulatory filing, each existing equity share with a face value of ₹10 will be split into five equity shares with a face value of ₹2 each, fully paid up. This marks Info Edge’s first-ever stock split, aimed at enhancing liquidity and making shares more affordable for retail investors. While announcing the Q3 FY25 results, Hitesh Oberoi, Managing Director & CEO of Info Edge, highlighted the company’s 16% billing growth, driven by consistent performance across all four business verticals. The recruitment segment maintained its growth trajectory, significantly contributing to improved operating profits, while the non-recruitment businesses are nearing breakeven, further solidifying Info Edge’s position for sustained expansion. 

In addition to its operational growth, Info Edge Ventures participated in a $1 million pre-seed funding round for ‘shoppin’, an AI-powered fashion search engine. The funding will be primarily utilized for hiring AI engineers, enhancing proprietary technology, and scaling advanced AI models such as custom-built SLMs and embedding models tailored for the fashion industry. Utsav Soi, Co-founder & CTO of Shoppin’, emphasized the company’s vision, stating, “Our foundational AI models for fashion and autonomous agents for commerce have enabled us to revolutionize fashion search.” With continued investments and strategic initiatives, Info Edge remains a key player in India’s consumer internet landscape, reinforcing its commitment to innovation and long-term growth. 

Business Segments

Info Edge operates across three key business segments: 

  1. Core Business – Recruitment 
    Info Edge is a market leader in the online recruitment sector, with platforms like Naukri.com, NaukriGulf.com, and FirstNaukri.com. This segment remains the company’s primary revenue driver. 
  1. Internal Portfolio – Real Estate, Education, and Matrimony 
    The company has developed and managed online platforms catering to real estate (99acres.com), education (Shiksha.com), and matrimony (Jeevansathi.com). These businesses have benefited from the increasing shift towards digital platforms and growing internet penetration in India.  
  1. Investment Portfolio – Strategic Investments in Internet-Based Businesses 
    Info Edge acts as an investor and strategic partner in several internet-driven businesses, providing supervisory and operational support while allowing entrepreneurs to manage daily activities. In addition to promoting businesses internally, Info Edge recognizes opportunities that a burgeoning internet sector provides. The company has invested in many early-stage start-up ventures to support the growth of these entrepreneurial-driven activities; gain from enhanced value creation, where this occurs; and bring such enterprises into the Info Edge fold. Notable investments include Zomato, Policybazaar, and various other startups. It has a 46 % shareholding holding in Zomato, which is India’s leading restaurant ratings and review site, a 10 % shareholding in Policybazaar which is India’s one of the leading insurance comparison sites & 59 % shareholding in Meritnation.com, which is a Supplementary online learning for K12 and Entrance Exams. 

Subsidiary Information of Info Edge

Info Edge operates through multiple subsidiaries across its core business segments: 

1. Recruitment: 

  • Naukri.com – Naukari.com is India’s leading online recruitment classifieds platform with a dual revenue model (job listings, employer branding, and resume database access). It commands over 75% of market traffic, with major revenue from recruiters. 
  • NaukriGulf.com – It is a job portal catering to the Gulf market (UAE, Saudi Arabia, Qatar, Bahrain, Oman, Kuwait) since 2006. 
  • FirstNaukri.com – It is a fresher hiring portal focusing on digitized campus recruitment. 
  • Quadranglesearch.com—In addition to the online recruitment business, Quadrangle offers offline placement services to middle and senior management.  

2. Matrimony: Jeevansathi.com – Jeevansathi.com is among India’s top three online matrimonial platforms, with strong presence in North and West India. Info Edge launched this in 1998. It operates on a subscription-based model and combines online and offline services.  

3. Real Estate: 99acres.com – 99acres.com is India’s one of the largest online real estate marketplaces, covering major cities, agents, and developers founded in 2005.  

4. Education: Shiksha.com – Shiksha.com is an online education classifieds platform helping students with academic and career guidance launched in 2008.  

Q3 2025 Earnings

  • Revenue from operations up 15 percent YoY to Rs 722.4 crore 
  • Total income jumps to Rs 915 crore 
  • Total expenses at Rs 480.7 crore 
  • EBITDA rose 20.5% to ₹290 crore in Q3 FY25 as against ₹240.5 crore in the same period a year back.  

Financial Summary

Amount in ₹ Cr Q3 FY24 Q3 FY25 FY23 FY24 
Revenue 627 722 2,346 2,536 
Expenses 444 457 1,997 1,825 
EBITDA 240.5 290 232 1014 
OPM 29% 37% 15% 28% 
Other Income 186 193 431 821 
Net Profit 119 288 -70 595 
NPM 18.98 39.89 -2.98 23.46 
EPS 11.68 18.72 -8.31 44.46 
Medanta (Global Health Ltd) Stock Falls
Medanta (Global Health Ltd) Stock Falls 13% in 3 Days Despite Strong Q4 Results

Global Health Ltd: Overview 

Global Health Limited, operating under the ‘Medanta’ brand, is a prominent private multi-specialty tertiary care provider in India, particularly in the northern and eastern regions. Established by renowned cardiovascular and cardiothoracic surgeon Dr. Naresh Trehan in 2004, the company has developed a network of five operational hospitals located in Gurugram, Indore, Ranchi, Lucknow, and Patna, with an additional facility under construction in Noida. As of June 30, 2022, Global Health offers healthcare services across more than 30 medical specialties, engaging over 1,300 doctors and encompassing an area of 4.7 million square feet with 2,467 installed beds. The company’s key specialties include cardiology, neurosciences, oncology, digestive and hepatobiliary sciences, orthopaedics, liver transplant, and urology. Global Health is committed to delivering advanced, end-to-end healthcare services, integrating state-of-the-art technology with a patient-centric approach to meet the diverse medical needs of its patients. The Indian healthcare industry is experiencing significant growth, driven by factors such as increasing population, rising prevalence of chronic diseases, and greater health awareness among the public. The demand for quality healthcare services is escalating, particularly in tertiary and quaternary care. Private healthcare providers like Global Health are expanding their presence to cater to this growing demand. The government’s initiatives to enhance healthcare infrastructure and promote public-private partnerships further bolster the industry’s outlook. However, challenges such as regulatory changes, high operational costs, and the need for continuous technological advancements persist. 

Latest Stock News 

During the year, the average occupied bed days increased by 10.5% year on year, reflecting an occupancy rate of 63.6% despite an increase in overall bed capacity. The number of in-patients grew by 12.9%, while out-patient visits saw an 8.7% rise year-on-year. The average revenue per occupied bed (ARPOB) registered a marginal increase of 1.2% year on year, reaching ₹61,307. Revenue from matured hospitals stood at ₹6,466 million, whereas developing hospitals contributed ₹3,004 million. Additionally, revenue from international patients witnessed a strong growth of 14.3% year-on-year, amounting to ₹541 million. Medanta Lucknow set a new milestone by performing 30 robotic gynaecological surgeries within 76 days, marking the highest number of robotic surgeries within the first 90 days of operation. Medanta Gurugram also achieved a significant feat, surpassing 75,000 joint replacements and other orthopaedic procedures. Medanta has paid Rs 125.11 crores and executed lease deed. In addition, the company need to purchase additional FSI from MHADA. The project cost including Land and FSI purchase is estimated to be in the range of Rs. 1,000-1,200 crores. The Noida hospital, a Greenfield project with a planned capacity of 550 beds, is progressing steadily. Construction commenced in September 2022, with Mechanical, Electrical, and Plumbing (MEP) work currently underway. The hospital is expected to begin operations with an initial capacity of 300 beds in the first or second quarter of FY26. 

Stock Potential 

Global Health Limited is well-positioned to capitalize on the favourable industry trends due to its established brand reputation, comprehensive service offerings, and strategic expansion plans. The company’s focus on high-quality patient care, coupled with its investment in advanced medical technologies, enhances its competitive edge. The ongoing construction of the Noida hospital and the recent expansion in Ranchi with a new about 110 bed facilities under a long-term lease agreement demonstrate the company’s commitment to increasing its capacity to meet rising healthcare demands. Additionally, Global Health’s emphasis on specialties such as cardiology, oncology, and neurosciences aligns with the increasing incidence of related health conditions, potentially driving higher patient volumes. The company’s robust financial performance, marked by consistent revenue growth and healthy profit margins, provides a solid foundation for future investments and expansion initiatives. 

Analyst Insights 

We maintain a positive outlook on Global Health Limited, citing its strong operational performance, strategic expansion, and focus on specialized healthcare services as key drivers of growth. The company’s consistent increase in patient volumes, coupled with its expanding network of hospitals, is expected to contribute to sustained revenue growth. The company’s effective cost management and improving operational efficiencies, which have led to enhanced profit margins. The expansion into new regions, such as the upcoming Noida facility and the additional hospital in Ranchi, is anticipated to further strengthen the company’s market position. However, we advise that monitoring factors such as regulatory changes, competition from other healthcare providers, and the execution of expansion projects. Overall, the company’s strategic initiatives and strong brand equity position it well for continued growth in India’s evolving healthcare landscape. 

Solar Industries India Ltd Q3 FY25 Results
Solar Industries India Ltd Q3 FY25 Results: Strong Net Profit Soars 55% YoY to ₹315 Crore, Revenue Up 38%

Solar Industries India Ltd: Overview 

Solar Industries India Ltd. is a leading manufacturer of explosives and explosive initiating systems, primarily serving the mining, infrastructure, and defense sectors. Headquartered in Nagpur, India, the company has a strong presence in the domestic market and is increasingly expanding its international footprint. Solar Industries offers a comprehensive range of products, including bulk explosives, packaged explosives, detonators, and initiating systems, catering to diverse blasting requirements. Beyond explosives, the company has diversified into the defense sector, manufacturing propellants, warheads, and other defense-related products. Solar Industries focuses on innovation and technological advancement, investing in research and development to enhance its product offerings and maintain a competitive edge. Their manufacturing facilities are strategically located to serve their customer base efficiently. The industry outlook for Solar Industries is positive, driven by several key factors. Continued growth in infrastructure development, particularly in emerging economies, is expected to drive demand for explosives used in construction and mining activities. The mining sector, both domestically and globally, remains a significant consumer of explosives, and growth in this sector will further fuel demand. Furthermore, increasing focus on national security and defense modernization is creating substantial opportunities for companies like Solar Industries, which are involved in the manufacturing of defense-related products. The global explosives market is also witnessing a trend towards the use of more sophisticated and environmentally friendly blasting technologies, which presents opportunities for companies that invest in R&D. While the industry is subject to regulatory oversight and faces competition from both domestic and international players, the overall outlook remains favourable for Solar Industries, given its established market position, diversified product portfolio, and focus on innovation. 

Latest Stock News 

Solar Industries India Ltd. demonstrated a robust performance in its core Explosives business. During the reported period, the company sold a substantial quantity of explosives, totalling 155,222 metric tons. This represents a slight increase of 1% compared to the previous period’s sales volume of 154,421 metric tons, indicating consistent demand for their explosive products. The total value realized from these explosive sales amounted to ₹695 crore, marginally higher than the ₹692 crore generated in the corresponding period last year. This stable performance in the face of potential market fluctuations underscores the company’s strong market position and the consistent demand from its key customer segments, primarily in the mining and infrastructure sectors. The company’s ability to maintain both sales volume and value demonstrates its resilience and effective sales strategies. Furthermore, the Initiating Systems segment also witnessed significant growth, with revenue increasing by 14% to ₹156 crore compared to the previous period’s ₹137 crore. The Defense segment contributed a substantial 21% to the company’s overall revenue, generating ₹409 crore. This highlights the increasing importance of the defense sector as a growth driver for the company and its successful penetration into this specialized market. Additionally, the company’s international business generated about ₹758 crores in revenue representing significant 38% of the company’s total revenue. This demonstrates the company’s expanding global footprint and its success in capitalizing on opportunities in international markets. The healthy contribution from both the Defense and International segments underscores Solar Industries’ strategic diversification and its ability to generate revenue from multiple avenues. Looking ahead, the company boasts a strong order book of ₹7122 crore, primarily driven by orders from Coal India Limited (CIL), Singareni Collieries Company Limited (SCCL), and the defense sector. 

Business Segments 

  • Explosives: This segment encompasses the development, manufacturing, and sale of a wide range of explosives and explosive initiating systems. This includes bulk explosives, packaged explosives, detonators, and other related products used in various blasting applications. The explosives segment caters to diverse industries, including mining, infrastructure development, and quarrying. Solar Industries has a strong market share in the domestic explosives market and is actively expanding its presence in international markets. The explosives segment is the core revenue generator for Solar Industries, and its performance is closely tied to the growth of the mining and infrastructure sectors.  
  • Defense: This segment focuses on the development and manufacturing of defense-related products, including propellants, warheads, and other specialized munitions. This segment has emerged as a significant growth driver for Solar Industries in recent years, as the Indian government focuses on strengthening its defense capabilities and promoting indigenous defense manufacturing. This segment provides diversification and reduces reliance on the cyclical nature of the mining and infrastructure sectors. 

Subsidiary Information 

  • Economic Explosives Pvt Ltd: This subsidiary is involved in the manufacturing and sale of industrial explosives and blasting accessories. It plays a crucial role in strengthening Solar Industries’ presence in the domestic explosives market and catering to the needs of various industries. 
  • Solar Overseas FZE: Located in the UAE, this subsidiary serves as a key hub for Solar Industries’ international operations, facilitating exports and expanding its reach in overseas markets. It plays a vital role in the company’s global expansion strategy. 
  • Solar Industries (Africa) Pty. Ltd: This subsidiary focuses on expanding Solar Industries’ presence in the African market, capitalizing on the growing mining and infrastructure sectors in the region. It contributes to the company’s international growth and diversification. 
  • Solar Composites Pvt Ltd: This subsidiary is involved in the manufacturing of composite materials, which have applications in both the explosives and defense sectors. It supports Solar Industries’ focus on developing advanced materials and technologies. 
  • Mahaveer Explosives Pvt Ltd: This subsidiary is another key player in the explosives market, further strengthening Solar Industries’ presence and market share in the domestic market. It provides additional manufacturing capacity and contributes to the company’s overall explosives business. 

Q3 FY25 Earnings 

  • Revenue of ₹1973 crore in Q3 FY25 up by 38% YoY from ₹1429 crore in Q3 FY24.  
  • EBITDA of ₹527 crore in this quarter at a margin of 27% compared to 25% in Q3 FY24. 
  • Profit of ₹338 crore in this quarter compared to a ₹222 crore profit in Q3 FY24. 

Financial Summary 

Amount in ₹ Cr Q3 FY24 Q3 FY25 FY23 FY24 
Revenue 1429 1973 6918 6070 
Expenses 1074 1447 5582 4588 
EBITDA 355 527 1336 1482 
OPM 25% 27% 19% 24% 
Other Income 11 10 -16 -68 
Net Profit 222 338 811 875 
NPM 15.5% 17.1% 11.7% 14.4% 
EPS 22.5 34.8 83.7 92.4 
Zydus Lifesciences Q3 Results
Zydus Lifesciences Q3 Results: Profit Soars 29.6%, Strong Revenue Grows 16.9%

Zydus Lifesciences Ltd: Overview 

Zydus Lifesciences Ltd., formerly known as Cadila Healthcare Ltd., is a global pharmaceutical company headquartered in Ahmedabad, India. With a strong focus on research and development, Zydus is engaged in the discovery, development, manufacturing, and marketing of a wide range of pharmaceutical products, including generics, branded formulations, biosimilars, vaccines, and APIs (Active Pharmaceutical Ingredients). The company has a significant presence in both domestic and international markets, catering to diverse therapeutic areas like cardiovascular, diabetes, oncology, pain management, and infectious diseases. Zydus operates manufacturing facilities and research centers across India and other countries, and its products are sold in numerous markets worldwide. The pharmaceutical industry is experiencing robust growth, driven by factors like an aging global population, increasing prevalence of chronic diseases, rising healthcare expenditure, and growing demand for affordable medicines. The industry is also witnessing a shift towards innovative therapies, including biologics and biosimilars, creating opportunities for companies like Zydus with strong R&D capabilities. Furthermore, the increasing focus on preventive healthcare and wellness is contributing to the growth of the pharmaceutical market. While the industry faces challenges like stringent regulatory requirements, pricing pressures, and increasing competition, the overall outlook remains positive, with continued growth expected in the coming years. Zydus, with its diversified product portfolio, global presence, and focus on innovation, is well-positioned to capitalize on these growth opportunities.  

Latest Stock News 

Zydus Lifesciences experienced strong performance across several business segments. The India formulations business outperformed the market, driven by robust growth in chronic therapies, with secondary sales growth of 8% according to IQVIA. The Consumer Wellness business also delivered double-digit growth, supported by a healthy 4.8% volume increase despite a generally muted demand environment within the industry. The US formulations business maintained its positive momentum, achieving significant year-over-year growth fueled by both volume expansion and new product launches over the past year. International markets contributed to the overall success with double-digit growth driven by strong demand across various regions. The company’s capital expenditure for the quarter totalled ₹2,907 million, and its net cash position significantly improved to ₹30,916 million as of December 31, 2024, compared to ₹8,561 million at the end of March 2024. In Biotech & R&D it completed Phase III clinical trials for one of the biosimilars. Zydus continued to solidify its leadership in Nephrology and Oncology within its Super Specialty offerings. The Personal Care segment also saw strong demand and achieved robust double-digit growth. In the US formulations business specifically, Zydus filed 10 ANDAs (Abbreviated New Drug Applications), received approvals for 3 new products, and launched 5 new products. 

Business Segments

  • Generics: This segment focuses on the development, manufacturing, and marketing of generic pharmaceutical formulations. Zydus has a vast portfolio of generic medicines across diverse therapeutic areas, providing affordable treatment options to patients globally. Zydus continues to invest in R&D to expand its generic product portfolio and maintain its competitive edge.  
  • Branded Formulations: This segment comprises the development and marketing of branded pharmaceutical formulations, including prescription and over-the-counter (OTC) medications. Zydus has a portfolio of branded formulations in various therapeutic areas, catering to specific patient needs. The branded formulations business is driven by innovation, marketing efforts, and brand building.  
  • API (Active Pharmaceutical Ingredients): This segment focuses on the development and manufacturing of active pharmaceutical ingredients, which are the key components of pharmaceutical formulations. Zydus is a leading player in the API market, supplying high-quality APIs to both internal and external customers.  
  • Consumer Wellness: This segment focuses on the development, manufacturing, and marketing of consumer wellness products, including nutraceuticals, vitamins, and other health supplements. This segment allows Zydus to cater to the growing consumer focus on health and wellness. Zydus continues to expand its consumer wellness product portfolio to meet the evolving needs of consumers.  
  • Animal Health: This segment focuses on the development, manufacturing, and marketing of animal health products, including pharmaceuticals and vaccines for livestock and companion animals. This segment caters to the growing demand for animal health products, driven by increasing pet ownership and the growing livestock industry. Zydus continues to invest in research and development to expand its animal health product portfolio. 

Subsidiary Information

  • Zydus Wellness Ltd: The Company’s subsidiary spearheads the group’s operations in the wellness space. ZWL operates in two different segments viz. personal care segment and food and nutrition segment and has a portfolio of category-leading health and wellness products. Five out of the six brands of the Company continue to hold leadership positions in their respective categories  
  • Zydus Pharmaceuticals (USA) Inc.: It operates as Zydus’s main subsidiary in the United States, focusing on manufacturing and marketing generic formulations approved by the U.S. FDA. A significant contributor to Zydus’s international revenue, given the high demand for generics in the U.S. market.  
  • Zydus Healthcare Ltd: It manages Zydus’s branded formulations business in India, catering to a wide range of therapeutic areas such as cardiovascular, gastrointestinal, pain management, and oncology. A major revenue driver for Zydus in the Indian domestic market.  
  • Zydus Animal Health and Investments Ltd: It provides animal health products across livestock, poultry, and companion animals, including treatments, nutritional supplements, and anti-infectives. It expands Zydus’s reach into veterinary and animal health segments, which are growing markets in India and internationally.  
  • Zydus Biosimilars Ltd: A dedicated unit for biosimilars, developing and commercializing biosimilars for therapeutic areas like oncology, immunology, and nephrology. Positions Zydus as a key player in biosimilars, targeting high-growth opportunities in biologics.  

Q3 FY25 Earnings 

  • Revenue of ₹5269 crore in Q3 FY25 up by 16.9% YoY from ₹4505 crore in Q3 FY24.  
  • EBITDA of ₹1388 crore in this quarter at a margin of 26% compared to 24% in Q3 FY24. 
  • Profit of ₹1026 crore in this quarter compared to a ₹790 crore profit in Q3 FY24. 

Financial Summary 

Amount in ₹ Cr Q3 FY24 Q3 FY25 FY23 FY24 
Revenue 4505 5269 17237 19547 
Expenses 3403 3882 13378 14163 
EBITDA 1102 1388 3860 5384 
OPM 24% 26% 22% 28% 
Other Income 60 57 -422 293 
Net Profit 790 1026 2092 3973 
NPM 17.5% 19.5% 12.1% 20.3% 
EPS 7.8 10.2 19.4 38.4 
Thermax Q3 FY25 Results
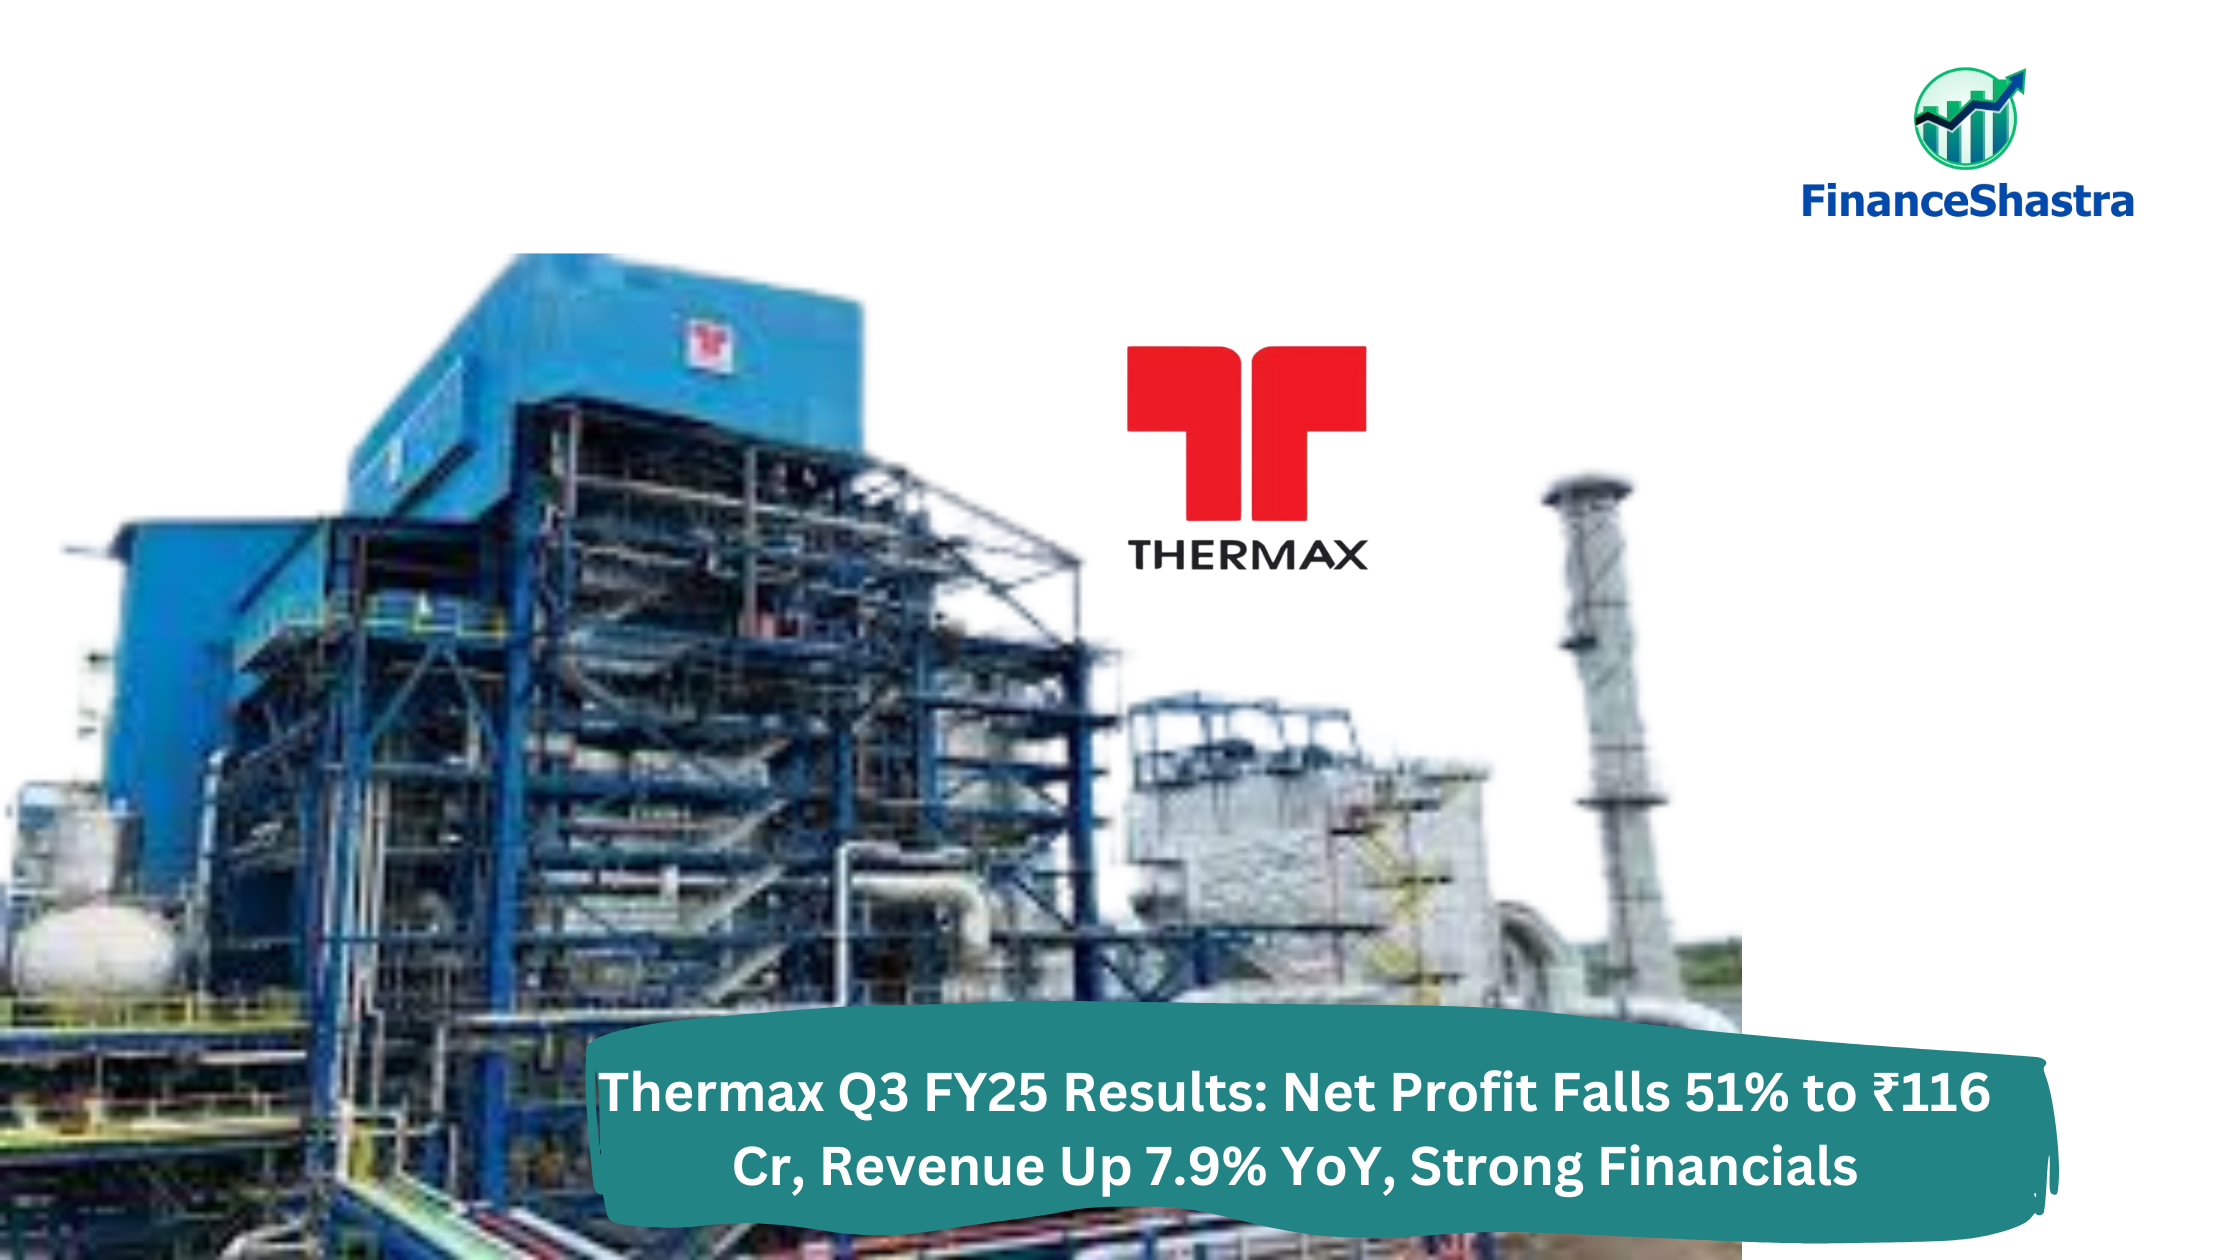
Thermax Q3 FY25 Results: Net Profit Falls 51% to ₹116 Cr, Revenue Up 7.9% YoY, Strong Financials

Thermax Ltd: Overview 

Thermax Ltd., headquartered in Pune, India, is a leading energy and environment solutions company. Established in 1966, it provides a wide range of products and services in heating, cooling, power generation, water and wastewater treatment, air pollution control, and waste heat recovery. Thermax has a strong presence in various industrial sectors, including chemicals, fertilizers, refineries, power, cement, and textiles. The company operates globally, with manufacturing facilities and sales offices in several countries. The industry outlook for Thermax is positive, driven by several factors. Growing environmental concerns and stringent regulations are increasing the demand for clean energy and pollution control solutions. The global focus on energy efficiency and sustainability is also creating opportunities for Thermax’s products and services. Additionally, the increasing industrialization and infrastructure development in emerging economies are driving the demand for power generation and water treatment solutions. Thermax’s diversified product portfolio, strong technological capabilities, and global presence position it well to capitalize on these industry trends. 

Latest Stock News 

Thermax has been actively involved in various energy and environmental projects. A significant achievement was the commissioning of a 36 MW energy plant for a major particle board manufacturer in southern India. In Africa, a 350 TR ultra-low pressure VAM was recently commissioned for a leading snack manufacturer, enabling them to recover waste heat from potato chip frying. The company also commissioned a 500 m3/hr water treatment plant (WTP) incorporating algae treatment and organic removal using submerged ultrafiltration. Positive results continue at the Dhuri plant, with June ’24 gas yield performance repeating with oxygenation in January ’25. Thermax Babcock & Wilcox Energy Solutions (TBWES) secured a landmark order for two 80 TPH multi-biomass fired reciprocating grate boilers for a major textile company in central India, representing the first instance of 100% paddy straw firing in such a boiler. Despite foreign exchange and currency headwinds, a leading Indian oil company saw a 10% increase in order bookings for oil coalescer resin compared to Q3 of the previous year, contributing to an overall 19% increase in order bookings for the company. Thermax also acquired Buildtech Products India Private Limited. However, the absence of large orders during the current quarter resulted in a lower order book. Finally, it’s important to note that last year’s profit after tax included a one-time gain of Rs. 126 crore from the sale of a vacant plot. 

Business Segments

  • Energy: This segment offers a comprehensive range of solutions for heating, cooling, and power generation. It includes boilers, heaters, chillers, heat pumps, and power generation systems. Thermax’s energy solutions cater to diverse industrial applications, helping customers optimize energy efficiency and reduce operating costs. 
  • Environment: This segment focuses on providing solutions for water and wastewater treatment, air pollution control, and waste heat recovery. It offers water treatment plants, effluent treatment systems, air pollution control equipment, and waste heat recovery systems. Thermax’s environment solutions help industries comply with environmental regulations and achieve sustainability goals. 
  • Chemicals: This segment produces and markets a variety of specialty chemicals, including water treatment chemicals, construction chemicals, and performance chemicals. Thermax’s chemical solutions cater to various industries, providing specialized chemical formulations for diverse applications. 

Subsidiary Information

  • Thermax Babcock & Wilcox Energy Solutions Private Ltd: This subsidiary is a joint venture with Babcock & Wilcox, focusing on providing advanced technology solutions for power generation. It specializes in designing, engineering, and constructing power plants and offers a range of services, including project management, engineering, procurement, and construction.  
  • Thermax Sustainable Energy Solutions Ltd: This subsidiary focuses on renewable energy solutions, including solar, wind, and biomass-based power generation. It aims to promote sustainable energy practices and help customers transition to cleaner energy sources.  
  • Thermax Environment Co. Ltd: Based in China, this subsidiary specializes in providing environmental solutions for the Chinese market. It offers water and wastewater treatment, air pollution control, and waste heat recovery solutions.  
  • Thermax Engineering (Shanghai) Co. Ltd: This subsidiary, based in China, provides engineering and project management services for Thermax’s projects in the Asia Pacific region. It supports the company’s operations in the region and ensures efficient project execution. 

Q3 FY25 Earnings 

  • Revenue of ₹2508 crore in Q3 FY25 up by 7.9% YoY from ₹2324 crore in Q3 FY24.  
  • EBITDA of ₹188 crore in this quarter at a margin of 8% compared to 8% in Q3 FY24. 
  • Profit of ₹114 crore in this quarter compared to a ₹237 crore profit in Q3 FY24. 

Financial Summary 

Amount in ₹ Cr Q3 FY24 Q3 FY25 FY23 FY24 
Revenue 2324 2508 8090 9323 
Expenses 2137 2319 7489 8526 
EBITDA 187 188 601 797 
OPM 8% 8% 7% 9% 
Other Income 185 32 156 307 
Net Profit 237 144 451 643 
NPM 10.2% 5.7% 5.6% 6.9% 
EPS 20 9.7 37.8 54.2 
Gland Pharma and Alembic's Pharma Q3 Results
Q3 FY25 Results: Gland’s pharma Net Profit Up 7%, and Alembic’s Pharmaceuticals Declines 23%

Gland Pharma Ltd: Overview 

Gland Pharma Ltd. is a leading injectable-focused pharmaceutical company based in India, known for its expertise in complex generics and sterile injectables. Established in 1978, the company has grown into a major global player with a strong presence in regulated markets such as the United States, Europe, Canada, Australia, and India. Gland Pharma specializes in contract development and manufacturing (CDMO), ready-to-use injectables, and complex formulations, including biologics, oncology drugs, peptides, and hormones. The company’s manufacturing infrastructure includes seven world-class facilities approved by stringent regulatory agencies like the USFDA, MHRA (UK), and TGA (Australia). Gland Pharma operates across various delivery formats, including vials, ampoules, pre-filled syringes, cartridges, and lyophilized injections. The company continues to expand its global footprint by entering new therapeutic segments and strengthening its supply chain network. With a robust research and development (R&D) pipeline and increasing capacity expansion, Gland Pharma remains a key player in the high-margin injectable business, focusing on innovation and efficiency in drug delivery solutions. The global injectable drugs market is experiencing steady growth due to rising chronic disease prevalence, an aging population, and increasing demand for biologics and complex generics. The injectable segment is projected to expand further, driven by advancements in drug formulations, increasing adoption of biosimilars, and the shift towards prefilled syringes and auto-injectors. The Indian pharmaceutical industry, especially the injectables sector, is benefiting from cost-effective manufacturing, a strong regulatory framework, and growing outsourcing demand from global pharmaceutical firms. However, industry challenges such as pricing pressure in regulated markets, supply chain disruptions, and stringent regulatory compliance remain key factors to monitor. With increasing investments in CDMO services and expansion into newer geographies, Gland Pharma is well-positioned to leverage the rising demand for injectable pharmaceuticals worldwide. 

Latest Stock News 

During the quarter, the company introduced 13 new molecules; including chlorpromazine, dexamethasone, phenylephrine, and phytonadione, further expanding its product portfolio. In regulatory filings, the company submitted four ANDAs and received eight ANDA approvals in Q3 FY25, bringing its total ANDA filings in the U.S. to 366, of which 312 have been approved while 54 remain pending. Globally, the company now has 1,736 product registrations, reinforcing its international presence. R&D expenses for the quarter stood at ₹437 million, accounting for 4.3% of revenue, highlighting continued investment in innovation. The company incurred a total capex of ₹1,379 million during the quarter ended December 31, 2024, reflecting its commitment to infrastructure and capacity expansion. At the Fontenay site in Paris, France, production during Q3 FY25 was affected by an unannounced inspection conducted by ANSM, the French health authorities. However, a key positive development was the commencement of Cenexi’s new high-capacity ampoule line, which started production as scheduled. This new facility is expected to enhance ampoule manufacturing capacity by 40–50 million units, significantly strengthening operations. Cenexi remains on track to achieve positive EBITDA in the next fiscal year, supported by revenue growth surpassing the €200 million mark. Meanwhile, in the Indian market, the company faced a decline in revenue, primarily due to a drop in sales volume. 

Q3 FY25 Earnings 

  • Revenue of ₹1384 crore in Q3 FY25 down by 10.3% YoY from ₹1545 crore in Q3 FY24.  
  • EBITDA of ₹360 crore in this quarter at a margin of 26% compared to 23% in Q3 FY24. 
  • Profit of ₹205 crore in this quarter compared to a ₹192 crore profit in Q3 FY24. 

Alembic Pharmaceuticals Ltd: Overview 

Alembic Pharmaceuticals Ltd. is a diversified pharmaceutical company with over a century of expertise in manufacturing and marketing pharmaceutical products across various therapeutic segments. Founded in 1907, the company has built a strong portfolio in formulations, active pharmaceutical ingredients (APIs), and specialty generics. Alembic Pharma operates globally, with a significant presence in India, the United States, Europe, and emerging markets. The company’s strength lies in its robust R&D capabilities, having invested heavily in developing high-value, complex generics, biosimilars, and differentiated formulations. It has a strong pipeline of USFDA-approved drugs, particularly in the oral solids, injectables, dermatology, and ophthalmology segments. The company continues to focus on expanding its specialty business, scaling up R&D investments, and diversifying into niche therapeutic areas to drive long-term growth. The Indian pharmaceutical sector remains a critical player in the global pharmaceutical supply chain, contributing significantly to generic drug exports and API manufacturing. With increasing healthcare needs, rising chronic disease burdens, and expanding regulatory approvals, the industry is poised for sustained growth. The global generics market is witnessing pricing pressures and regulatory challenges, but companies like Alembic Pharmaceuticals are countering these headwinds by focusing on complex generics, specialty drugs, and biosimilars. The rising demand for oncology, neurology, and cardiovascular drugs, along with higher adoption of biologics and specialty medications, presents significant growth opportunities. Alembic Pharmaceuticals, with its strong R&D pipeline, operational efficiencies, and strategic market expansions, is well-positioned to capitalize on emerging opportunities in both domestic and international markets while navigating industry challenges 

Latest Stock News 

The India Branded Business recorded a modest growth of 3%, reaching revenue of ₹6.14 billion for Q3 FY25. In the US Generics segment, revenue grew by 10% YoY, primarily driven by the successful ramp-up of key product launches and an increase in market share for select existing products. The momentum is expected to continue, with new product introductions further fuelling growth in the upcoming quarters. The Ex-US Generics segment also reported a 10% YoY growth, reflecting strong market demand. Product registrations and dossier extensions into new markets remain on track, positioning the company for accelerated growth. However, the API segment witnessed a 10% YoY decline, primarily due to lower off-take from select customers and pricing headwinds. Despite this short-term setback, a healthy order book is expected to drive a rebound in the coming quarters. The company holds a 1.4% market share in the Indian pharmaceutical space, with four key brands generating revenues of over ₹1 billion. The Animal Health business delivered an impressive 22% growth, driven by a strong portfolio of well-established brands. In the US market, the company has built a robust front-end presence with a solid customer base, launching two new products in Q3 FY25 and a total of 159 products to date. Additionally, over five new product launches are expected in Q4 FY25, further strengthening the company’s foothold. On the sustainability front, the company remains committed to achieving its ESG goal of Net-Zero emissions by 2040. 

Q3 FY25 Earnings 

  • Revenue of ₹1693 crore in Q3 FY25 up by 3.81% YoY from ₹1631 crore in Q3 FY24.  
  • EBITDA of ₹260 crore in this quarter at a margin of 15% compared to 16% in Q3 FY24. 
  • Profit of ₹138 crore in this quarter compared to a ₹185 crore profit in Q3 FY24. 
Triveni Turbine
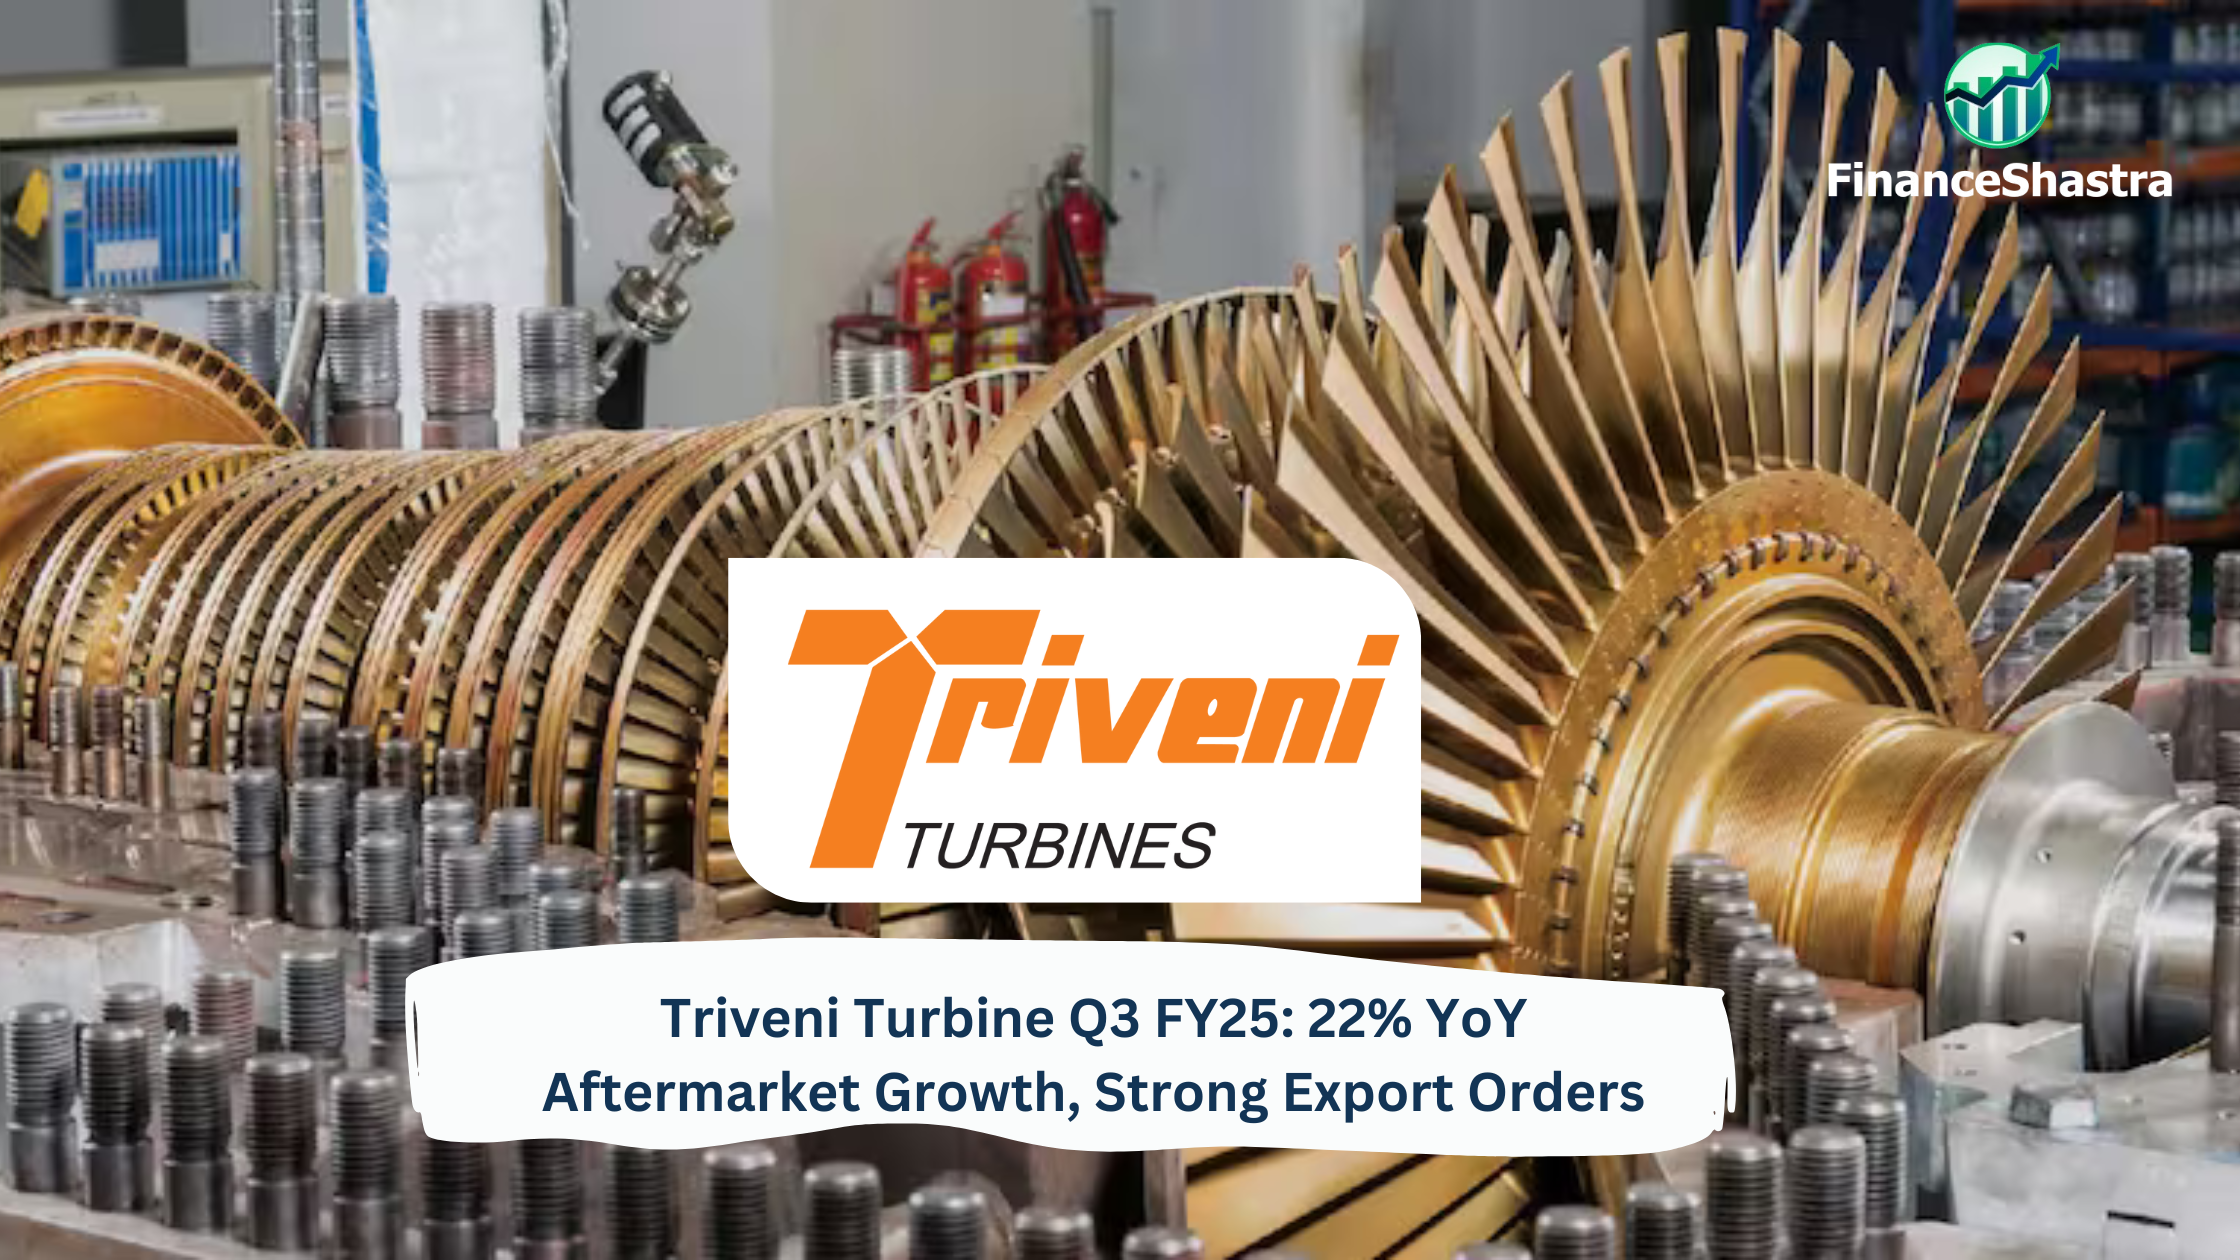
Triveni Turbine Q3 FY25: 22% YoY Aftermarket Growth, Strong Export Orders

Triveni Turbine LtdOverview 

Triveni Turbine Limited (TTL) is a leading industrial steam turbine manufacturer based in India, specializing in the design, manufacture, and servicing of steam turbines up to 100 megawatts (MW). With over five decades of experience, TTL has established a significant global presence, with more than 6,000 turbine installations across 20 industries in over 80 countries. The company’s product portfolio includes back-pressure and condensing steam turbines, catering to a wide range of pressure and flow applications. TTL serves various sectors, including sugar, distillery, paper, textiles, palm oil, chemicals, and independent power plants. The company operates state-of-the-art manufacturing facilities in Bengaluru, Karnataka, and is known for its engineering excellence and innovative solutions in power generation and mechanical drive applications. The global steam turbine market is experiencing steady growth, driven by increasing energy demand, industrialization, and the need for efficient power generation solutions. In emerging economies, rapid industrial growth and urbanization are leading to higher energy consumption, thereby boosting the demand for steam turbines. Additionally, the shift towards renewable energy sources and the integration of combined heat and power (CHP) systems are creating new opportunities for steam turbine manufacturers. The emphasis on energy efficiency and sustainability is also encouraging industries to adopt advanced turbine technologies. However, the industry faces challenges such as stringent environmental regulations and competition from alternative power generation technologies. Companies like TTL, with a focus on innovation and customization, are well-positioned to capitalize on these trends by offering efficient and reliable turbine solutions tailored to diverse industrial applications. 

Latest Stock News 

Triveni Turbine Limited (TTL), a leading company specializing in industrial heat and power solutions and decentralized steam-based renewable turbines of up to 100 MW, announced its performance results for the third quarter and nine months ending December 31, 2024. The Aftermarket segment achieved a record turnover of ₹1.8 billion during the quarter, marking a 22% year-on-year (YoY) increase and contributing 35% to the total turnover. The Product segment also recorded a robust performance, with a turnover of ₹3.3 billion in Q3 FY25, reflecting a 14% YoY growth. Export order bookings grew by 9% YoY to ₹3.5 billion, while domestic order bookings declined by 16% YoY to ₹1.8 billion. Export orders accounted for 66% of the total order booking, highlighting TTL’s growing international footprint. The company maintained a strong cash position, with cash and investments standing at ₹8,831 million as of March 31, 2024, providing ample financial flexibility for future growth initiatives. On the Product side, order bookings surged by 30% YoY to ₹12.8 billion, primarily driven by increased international demand. The segment’s turnover for the nine-month period reached ₹9.7 billion, reflecting a 21% increase over the previous year. Meanwhile, the Aftermarket segment secured an order booking of ₹4.5 billion in 9M FY25, remaining largely stable on a YoY basis. The Aftermarket segment’s turnover for the nine-month period stood at ₹5.0 billion, marking a 26% YoY growth. Its contribution to total turnover increased slightly to 34% in 9M FY25, compared to 33% in the same period last year. 

Stock Potential 

Triveni Turbine Limited has significant growth potential, supported by its strong order book, expanding international presence, and focus on high-margin aftermarket services. The company’s emphasis on research and development enables it to offer customized solutions, catering to specific industry requirements. TTL’s strategic initiatives to penetrate new markets, particularly in the oil and gas sector with API-compliant turbines, and its expansion into higher power ranges up to 100 MW, are expected to drive future growth. The company’s robust domestic supply chain provides a competitive advantage, ensuring business continuity and cost efficiency. Furthermore, TTL’s commitment to sustainability and energy efficiency aligns with global trends, enhancing its appeal to environmentally conscious clients. 

Analyst Insights 

We maintain a positive outlook on Triveni Turbine Limited, citing its consistent financial performance, strong market position, and growth prospects. In recent quarters, TTL has reported impressive revenue and profit growth, driven by both domestic and international orders. The company’s focus on expanding its aftermarket services has resulted in significant increases in order bookings and sales, contributing to higher margins. Analysts anticipate that TTL’s strategic initiatives, such as developing new market segments and enhancing its product portfolio, will sustain its growth momentum. However, they also caution about potential risks, including economic slowdowns in key markets and fluctuations in raw material prices, which could impact profitability. 

Titan Q3 FY25 Results
Titan Q3 FY25 Results: Strong 25% Revenue Growth to ₹17,740 Cr, Net Profit Dips to ₹1,047 Cr

Titan Company Ltd: Overview 

Titan Company Limited, a subsidiary of the Tata Group, is one of India’s leading lifestyle and consumer goods companies with a strong presence across various product categories, including jewellery, watches, eyewear, and other emerging businesses. Established in 1984, the company has grown to become a household name, synonymous with trust, innovation, and quality. Titan’s core strength lies in its ability to blend traditional craftsmanship with modern design and technology, making it a market leader in multiple segments. The company operates a vast retail network with over 2,000 stores across India and a growing international footprint. Titan’s commitment to innovation is evident in its strong brand portfolio, including Tanishq, CaratLane, Fastrack, Sonata, Titan Eye+, and Skinn. Over the years, the company has diversified into new categories such as fragrances, ethnic wear, and smart wearables, positioning itself as a key player in India’s evolving lifestyle market. With a focus on customer-centric strategies, Titan continues to strengthen its omni-channel presence by integrating digital and in-store experiences, enhancing convenience and engagement for its customers. The Indian lifestyle and retail industry is poised for robust growth, driven by rising disposable incomes, urbanization, and increasing consumer preferences for branded and premium products. The jewellery sector, Titan’s largest revenue driver, is expected to benefit from steady gold demand, favourable government policies, and a shift from unorganized to organized retail. The eyewear segment is gaining traction due to increased awareness of eye health and digital screen exposure, fuelling demand for prescription glasses and sunglasses. With digital transformation accelerating, e-commerce and omnichannel retail strategies are becoming crucial growth enablers for companies like Titan. Furthermore, Titan is well-positioned to capitalize on evolving trends, such as sustainable jewellery, personalization, and technology-driven product innovation. 

Latest Stock News 

The festive quarter played a crucial role in solidifying the FY25 growth trajectory after a subdued Q1 and a healthy Q2. The jewellery segment witnessed its strongest quarter of the fiscal year, with retail sales growing over 25%, driven by sustained consumer demand for gold as both adornment jewellery and a store of value. The analogue watches segment recorded a robust 20% retail growth, reaffirming Titan’s strong customer value proposition. Additionally, the EyeCare division saw a return to double-digit retail growth, marking a positive turnaround. The company maintains a positive outlook and expects to close FY25 with strong growth over FY24. In Q3FY25, total income from the jewellery segment and Titan Company (excluding bullion and digi-gold sales) stood at ₹286 crore, compared to ₹190 crore in Q3FY24. The jewellery division expanded its footprint with 11 net new Tanishq stores and 13 Mia stores in India. Consumer preference for gold remained strong, with gold jewellery sales growing by approximately 24% year-on-year, while gold coin sales saw a sharp rise of around 48%. CaratLane also demonstrated impressive growth, adding 19 net new stores in India during the quarter and opening its first international store in New Jersey. The brand’s total income grew by approximately 27% year-on-year to ₹1,117 crore. In the EyeCare division, Titan Eye+ closed three net new stores during the quarter. 

Business Segments

  • Jewellery: The jewellery division is the largest revenue contributor, with flagship brand Tanishq leading the organized jewellery market in India. Tanishq has built a strong reputation for purity, design innovation, and customer trust, offering a wide range of gold, diamond, and platinum jewellery. The premium and contemporary segments are covered through CaratLane and Mia by Tanishq, targeting younger and urban consumers. 
  • Watches & Wearables: Titan is a dominant player in the Indian watch industry, catering to different consumer segments through brands like Titan for premium watches, Fastrack for youth-focused casual wear, and Sonata for affordable timepieces. The company has also entered the smart wearables segment, leveraging its brand strength and distribution network. 
  • Eyewear: The eyewear business, under the Titan Eye+ brand, has established itself as a leading player in the prescription glasses and sunglasses market. Digital screen usage and growing eye health awareness are driving demand in this segment. Titan has also launched new collections with stylish and functional designs, targeting different age groups and customer preferences. 
  • Fragrances & Fashion Accessories: Titan’s foray into the fragrances market with Skinn has been well-received, with the brand gaining traction in the premium perfume segment. Taneira, Titan’s ethnic wear brand, focuses on handcrafted sarees and Indian apparel, catering to the growing demand for high-quality traditional fashion. The company also offers accessories under the Fastrack brand, including bags, belts, and wallets, targeting young consumers with trendy and affordable products. 

Subsidiary Information

  • CaratLane Trading Pvt Ltd: CaratLane is Titan’s subsidiary specializing in online jewellery retail, offering contemporary and lightweight designs catering to modern consumers. It has successfully bridged the gap between online and offline retail with its “Try at Home” service and increasing physical store presence. 
  • Tanishq International Operations: Expanding its global reach, Titan operates Tanishq stores in markets such as the UAE, Singapore, and the United States, targeting Indian expatriates and international luxury consumers. The company is investing in regional product customization and localized marketing strategies to strengthen its international presence. 
  • Favre-Leuba AG: Titan owns the Swiss luxury watch brand Favre-Leuba, which focuses on high-end mechanical watches. While it remains a niche brand, Titan’s acquisition of Favre-Leuba has helped enhance its credibility in the premium watchmaking segment. 
  • Titan Engineering & Automation Ltd. (TEAL): TEAL is Titan’s precision engineering and automation subsidiary, providing manufacturing solutions to industries such as aerospace, automotive, and healthcare. The company plays a strategic role in Titan’s expansion into technology-driven solutions. 
  • Titan Commodity Trading Ltd: This subsidiary manages Titan’s gold procurement and hedging activities, ensuring efficient cost management in the jewellery segment. It plays a crucial role in mitigating raw material price fluctuations, which significantly impact the company’s margins. 

Q3 FY25 Earnings 

  • Revenue of ₹17740 crore in Q3 FY25 up by 25.3% YoY from ₹14164 crore in Q3 FY24.  
  • EBITDA of ₹1674 crore in this quarter at a margin of 9% compared to 11% in Q3 FY24. 
  • Profit of ₹1047 crore in this quarter compared to a ₹1053 crore profit in Q3 FY24. 

Financial Summary 

Amount in ₹ Cr Q3 FY24 Q3 FY25 FY23 FY24 
Revenue 14164 17740 40575 51084 
Expenses 12599 16066 35693 45792 
EBITDA 1565 1674 4882 5292 
OPM 11% 9% 12% 10% 
Other Income 136 128 306 534 
Net Profit 1053 1047 3274 3496 
NPM 7.4% 5.9% 8.1% 6.8% 
EPS 11.9 11.8 36.6 39.4