IDBI Bank Ltd Q3 Earnings
IDBI Bank Ltd: Driving Growth and Stability in India’s Banking Sector

IDBI Bank Ltd: Overview 

IDBI Bank Ltd., a prominent player in the Indian banking sector, operates as a full-service bank offering a wide range of financial products and services to retail, corporate, and small business clients. Originally established in 1964 as the Industrial Development Bank of India, it was created to support India’s industrial growth. Over the years, it transitioned into a commercial bank while retaining its developmental focus. The bank’s offerings include savings and current accounts, loans, investment products, and payment solutions, alongside specialized services like project financing and treasury operations. Now majority-owned by Life Insurance Corporation of India (LIC), IDBI Bank benefits from the backing of one of the country’s largest financial institutions, which bolsters its financial stability and brand value. With a network of branches and ATMs spread across the nation, IDBI Bank aims to serve diverse customer segments effectively, supported by digital initiatives to enhance convenience and accessibility. The Indian banking industry is poised for steady growth, driven by economic expansion, increasing digital adoption, and a rising demand for financial inclusion. The sector is seeing a significant push toward modernization, with banks focusing on technology to streamline operations and improve customer experiences. However, challenges like rising competition, non-performing assets (NPAs), and regulatory pressures remain concerns. Within this dynamic environment, IDBI Bank is strategically positioned to leverage its strong parentage, operational expertise, and evolving digital capabilities to capture emerging opportunities. Its focus on improving asset quality and expanding its retail and MSME portfolios aligns with the broader industry trend of risk management and growth diversification. 

Latest Stock News 

Asset quality for IDBI Bank remained stable on a sequential basis, with gross non-performing assets (NPA) at 3.57% compared to 3.68% in the previous year. Net NPA for the quarter stood at 0.18%, showing a slight improvement from 0.2% in the preceding quarter. In another key development, the bank’s board approved the sale of its entire holding of 8.54 lakh shares, valued at ₹100 each, in Pondicherry Industrial Promotion Development and Investment Corporation Ltd. (PIPDIC), which represents a 21.14% stake in the associate company. 

The disinvestment process for IDBI Bank is gaining traction, with financial bids for a 60.72% stake expected to be invited by the end of the current fiscal year, according to government sources. This stake sale, which includes 30.48% held by the government and 30.24% by LIC, will involve transferring management control as part of the strategic sale. The process is one of the largest disinvestment efforts in the banking sector. Before proceeding, the Reserve Bank of India (RBI) conducted a “fit and proper” assessment of the bidders, ensuring compliance with regulatory norms. 

Following RBI clearance, the government opened a data room in November to allow bidders access to IDBI Bank’s legal and financial documents. This move facilitates a thorough due diligence process, enabling bidders to evaluate the bank’s performance and request additional information as needed. With these preparations in progress, financial bids are anticipated to finalize the future ownership structure of IDBI Bank by March 2025, marking a significant milestone in its strategic sale. 

Q3 FY24 Earnings 

  • Revenue of ₹7819 crore in Q3 FY25 up by 19.4% YoY from ₹6549 crore in Q3 FY24.  
  • EBITDA of ₹1854 crore in this quarter at a margin of 24% compared to 15% in Q3 FY24. 
  • Profit of ₹1954 crore in this quarter compared to a ₹1515 crore profit in Q3 FY24. 
IRFC Ltd: Driving India’s Railway Modernization and Growth

IRFC Ltd: Overview 

Indian Railway Finance Corporation Ltd. (IRFC) is the financial backbone of Indian Railways, established in 1986 to fund the modernization and growth of railway infrastructure across the country. The company focuses on raising capital for acquiring rolling stock, such as locomotives, coaches, and wagons, along with financing infrastructure projects and leasing operations essential to the Indian Railways. Operating under the Ministry of Railways, IRFC benefits from government backing, allowing it to secure low-cost finance through a mix of funding sources like bonds, term loans, and external commercial borrowings. Its strong financial stability and reliable performance make it a vital contributor to India’s railway expansion initiatives. The railway sector in India is on a rapid growth trajectory, fueled by the government’s emphasis on infrastructure upgrades, sustainability, and enhanced connectivity under programs like “Gati Shakti” and “Make in India.” With increased budget allocations, the sector is advancing toward electrification, high-speed rail development, and network expansion. As part of India’s goal to achieve carbon neutrality in railways by 2030, there is a growing need for green financing and technological modernization, areas where IRFC is set to play a critical role. While the company’s dependency on Indian Railways as its sole client may pose a risk, this is offset by the strategic importance of the railways to the nation’s economic development. With a solid financial foundation and alignment with government priorities, IRFC is well-positioned to seize the opportunities presented by the evolving railway industry. 

Latest Stock News 

Indian Railway Finance Corporation Ltd. (IRFC) announced on Tuesday, January 14, that it has been identified as the lowest bidder (L1) to finance ₹3,167 crore for the development of the Banhardih coal block, located in Latehar District, Jharkhand. The project is being executed by PVUN Ltd., a joint venture between NTPC Ltd., which holds a 74% equity stake, and Jharkhand Bijli Vitran Nigam Ltd., with a 26% stake. The Banhardih coal block, allocated to PVUNL as a captive coal source, is integral to the company’s operations, ensuring efficient coal transportation to its project site. The coal will be transported to the Chetar power station through a Mine-Gain-Rail (MGR) system and further moved using Indian Railways. Additionally, on Wednesday, January 15, IRFC announced the signing of a lease agreement with NTPC Ltd. to finance eight BOBR (Bogie Open Bottom Rapid) rakes. This investment is valued at approximately ₹250 crore, marking another step in IRFC’s ongoing commitment to supporting infrastructure and energy projects across India. 

Q3 FY25 Earnings 

  • Revenue of ₹6763 crore in Q3 FY25 up by 0.4% YoY from ₹6737 crore in Q3 FY24.  
  • EBITDA of ₹6724 crore in this quarter at a margin of 99% compared to 99% in Q3 FY24. 
  • Profit of ₹1631 crore in this quarter compared to a ₹1599 crore profit in Q3 FY24. 
PB Fintech Stock
PB Fintech Stock Plunges 6% to INR 1,706 Amid Market Volatility

Overview

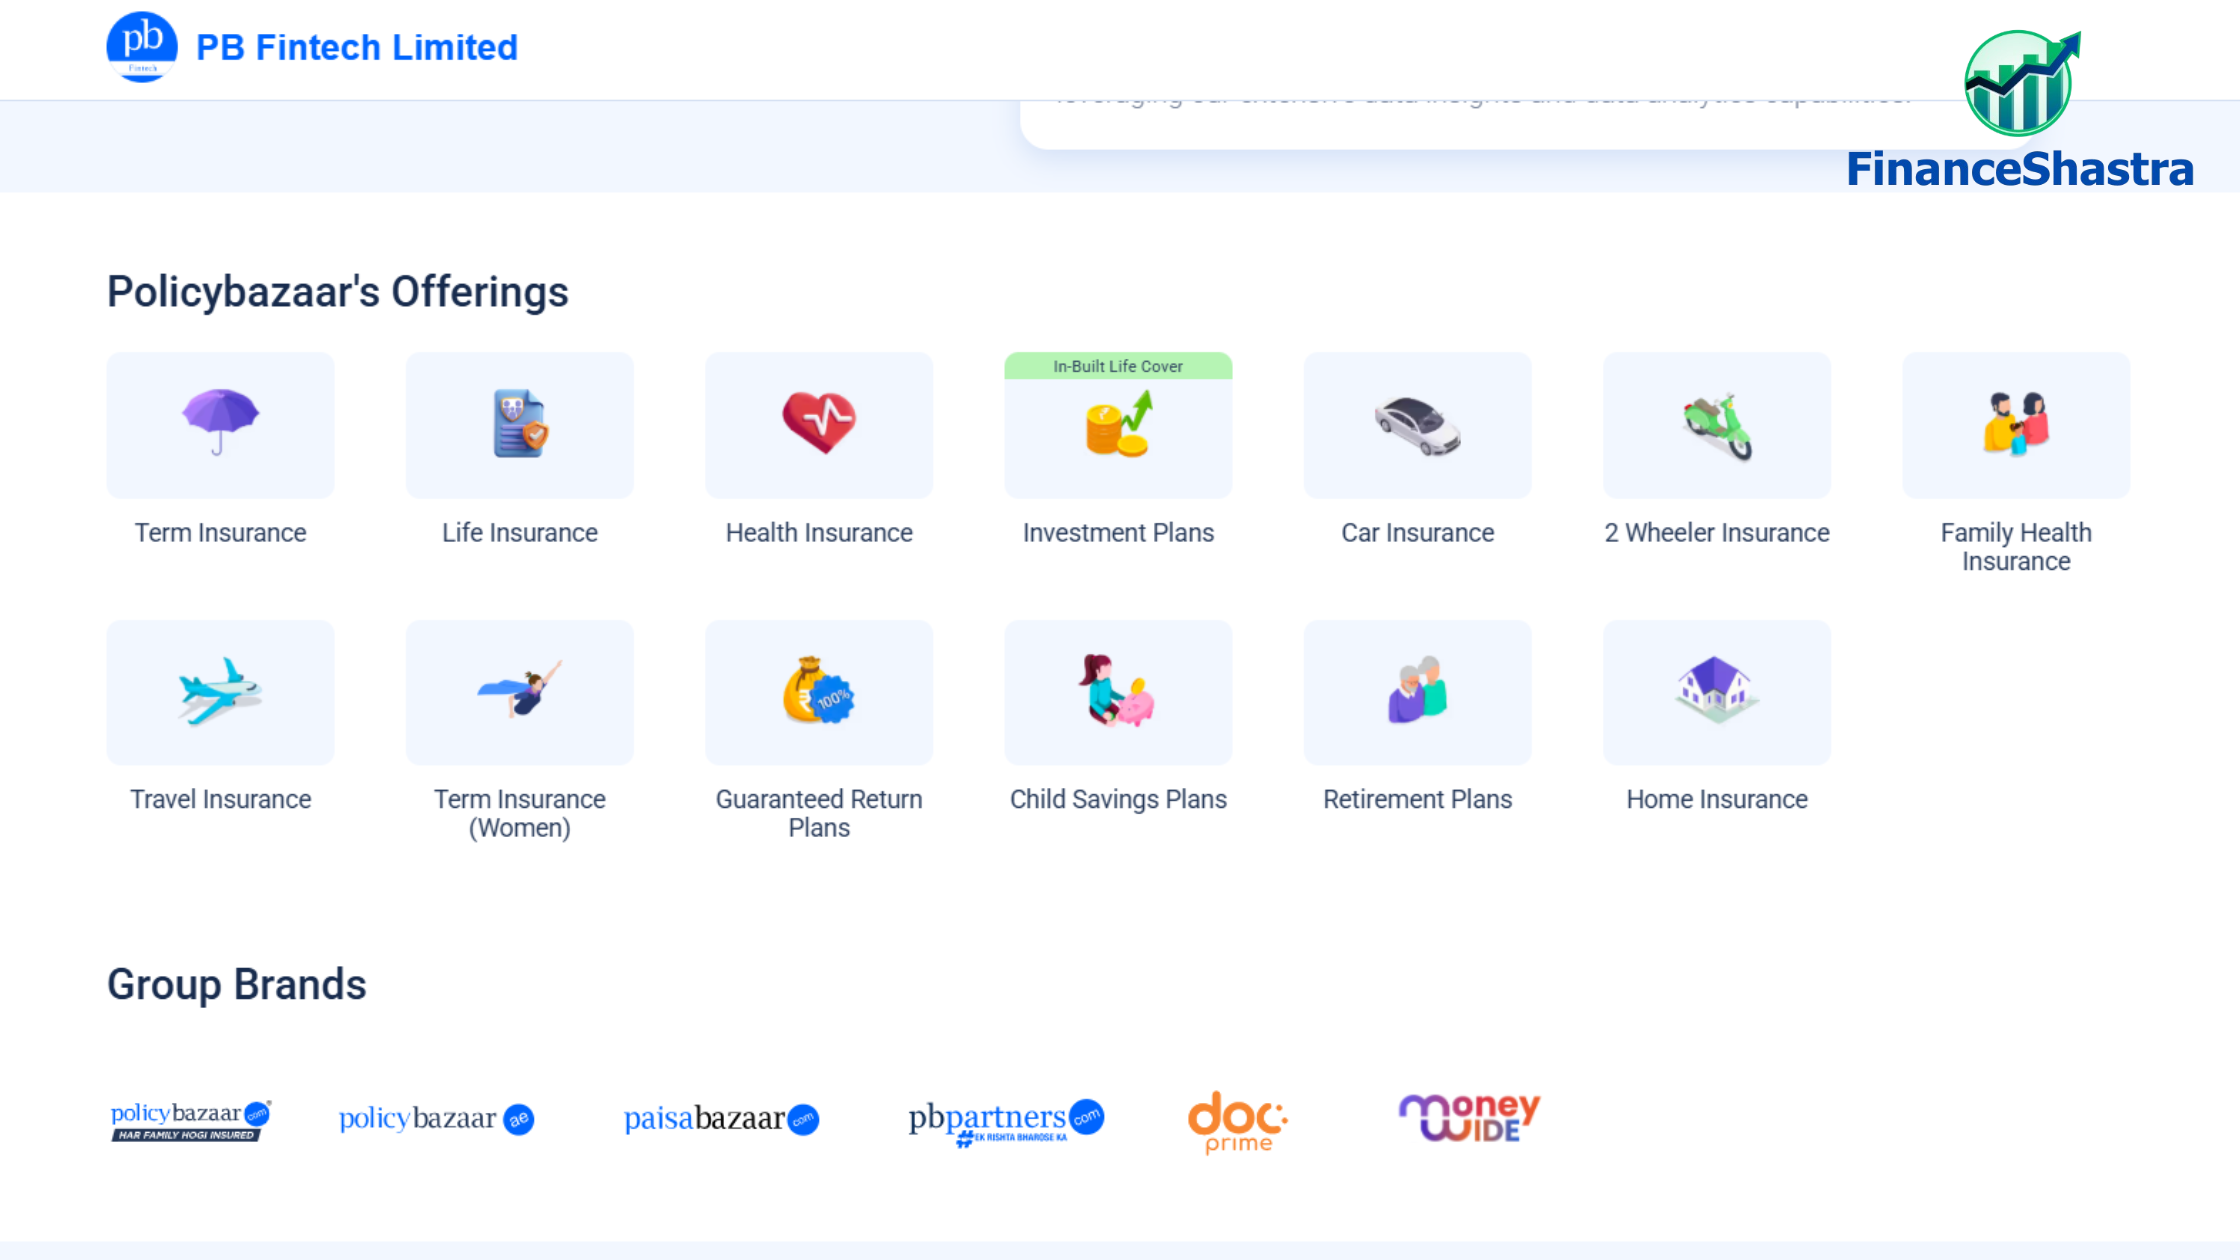
PB Fintech, the parent company of Policybazaar and Paisabazaar, is a leader in India’s insurance and fintech sectors. The company is known for leveraging technology to simplify insurance, loans, and other financial services for consumers. To expand its market presence, it has actively diversified into new segments, including healthcare and payment aggregation.

Despite strong financial growth and a positive long-term outlook, PB FinTech shares have recently faced trouble due to valuation concerns, regulatory inspections, and the challenge of seeing profits.

Latest News

  1. Intraday Decline: The stock nosedived by 6% to INR 1,706 during intraday trading on January 17 but recovered slightly to trade at INR 1,718.65 (-5.1%) by 12:20 PM.
  2. Brokerage Downgrade: Morgan Stanley downgraded the stock from “equal-weight” to “underweight,” citing lower profit emergence and high valuations, with a price target of INR 1,400 (14% downside).
  3. GST Raid: A subsidiary of PB Fintech was recently raided by the GST department in connection with vendor inquiries.
  4. Diversification Efforts:
    • Entered the healthcare segment via PB Healthcare Services Private Limited on January 2.
    • Expanded into the payment aggregator space with PB Pay in 2024.
    • Received an RBI account aggregator license for PB Financial Account Aggregator Private Limited in October 2024.
  5. Tax Relief: On January 4, PB Fintech received relief on a tax dispute, saving INR 166.12 Cr for FY 2015-16.

Financial summary

  • Market Capitalization: INR 78,923.99 Cr (as on 17 January 2025)
  • Latest stock performance:
    • Monthly return: -19% .
    • Annual return: +94.67%
    • Weekly Fall: -16.2% last week (The second biggest loser among 31 tracked technology stocks)
  • Highlights of Q2 FY 2025:
    • Net Profit: INR 50.98 Trillion (Loss INR 21.11 Trillion in Q2FY)
    • Operating income: INR 1,167.2 Cr (+43% YoY from INR 811.6 Cr)
    • 4th quarter continues to make profits
  • Important events: It entered the healthcare sector and touched an all-time high of Rs 2,254.95 on January 3, 2025.

PB Fintech’s long-term potential remains strong, fueled by diversification and revenue growth. However, short-term market challenges and valuation concerns are weighing on investor sentiment.

Piramal Pharma Limited: $200 Billion CDMO Market Opportunity

Piramal Pharma Ltd: Overview 

Piramal Pharma Limited is a global pharmaceutical company providing end-to end pharma solutions to its customers through its network of development and manufacturing facilities located in India, North America and the UK/Europe. It also offers a portfolio of differentiated products that it sells in over 100 countries across the world. PPL operates under three business verticals: Piramal Pharma Solutions (PPS) An integrated contract development and manufacturing organisation (CDMO); Piramal Critical Care (PCC) A complex hospital generics (CHG) business; and India Consumer Healthcare (ICH) The business of selling over-the-counter healthcare and wellness products. As per an industry report, the global pharmaceutical CDMO market size was estimated at US$ 140 Billion in 2023 and is projected to grow at a CAGR of 7% in 2024-30 to cross $200 billion. This growth would be primarily driven by rising investments in pharmaceutical R&D, demand for generic drugs. . In the global complex generics market, hospital generic products dominate with a share of around 70-80%, while retail products comprise the remaining portion. Key therapy areas within the complex hospital generic market include Anaesthesia, Pain Management, Blood-related, and Anti-Infective segments. 

Latest Stock News (17 Jan, 2025) 

Piramal Pharma has converted its coal-fired steam boiler to a biomass-fuelled one at its manufacturing facility in Digwal, India. The strategic conversion at the Digwal facility will eliminate approximately 24,000 tonnes of carbon dioxide equivalent (tCO2e) GHG emissions annually, accounting for about 17% of the company’s total emissions, said the company. Adopting biomass briquettes is a key advancement in Piramal’s sustainability journey. These briquettes are compacted blocks of biomass materials processed and compressed under high pressure. Biomass briquettes, made from agricultural waste, are a renewable fuel source that supports circular economy principles by recycling organic by-products, reducing waste, and promoting sustainability. “The transition to biomass briquettes at our Digwal facility is a testament to our commitment to reducing our environmental footprint while driving innovation in sustainable manufacturing. As we align our goals with global climate action frameworks, we will continue to contribute to a more sustainable future for generations to come,” said Nandini Piramal, chairperson, Piramal Pharma Limited. “This transformation at our Digwal facility underscores our commitment to environmental stewardship and sustainable operational practices,” said Peter DeYoung, CEO of Piramal Global Pharma. “By transitioning to biomass briquettes, we are significantly reducing our GHG emissions and setting new industry standards for responsible pharmaceutical manufacturing.” 

Stock Potential 

Piramal Pharma Ltd has strategically diversified its operations into three niche business segments, all of which are driving strong revenue growth. The company’s expansion into the U.S. market with new products and SKUs reflects its commitment to growth and innovation. Additionally, increasing government capital expenditure year-on-year is boosting demand, further benefiting the company. However, the fundamentals appear highly overvalued at a P/E of 527, which is significantly above industry norms. For investors to realize better returns, either the stock price needs to correct, or the company must achieve exponential revenue growth in the next year or two to justify its steep valuation. 

Why Adani Wilmar Shares Plunged
Why Adani Wilmar Shares Plunged: Key Reasons Behind the 9.2% Drop and Stake Sale Impact

Adani Wilmar Ltd. fell sharply 9.2% on the last trading day (Friday) to a one-day low of ₹291 on NSE. The fall came after one of its promoters, Adani Commodities LLP, announced a sale of up to 20% holding. The company submitted an offer (OFS) in this month (January 2025).

Strategic transformation by Adani Group

The share sale is in line with Adani Group’s broader strategy to exit non-core businesses. and focus on core infrastructure businesses including airports, roads, data centers, and green hydrogen. Sales generated a revenue of approximately Rs. 485 Cr., among these key activities. It will be a repeat investment.

Parent company Adani Enterprises plans to phase out Adani Wilmar. In the first phase, 13.5% of the shares will be sold through OFS, while in the second phase, Singapore’s Wilmar International Ltd will acquire the remaining shares at a price not exceeding ₹305 per share.

Impact on the market and shareholder changes

OFS has attracted huge interest from over 100 domestic and international investors, making it one of the largest OFS transactions in the recent history of the Indian capital market. The sale announcement, coupled with pressure in the broader market, sent shares of Adani Wilmar down 10% in price.

Investor structure after OFS: Adani Group’s stake in the joint venture decreased from 43.94% to 31.06% after the transaction, while Wilmar International It is set to purchase the remaining shares by March 2025.

Compliance and Finance

The sale of Adani Wilmar’s shares ensures compliance with Sebi’s minimum public shareholding (MPS) norms, which require public ownership of at least 25% in a listed entity. After OFS, public shareholders hold shares at 25.63%, while promoters hold 74.37% of the shares.

Business overview and growth trends

Adani Wilmar, an equal joint venture between Adani Group and Wilmar International, dominates the Indian FMCG sector with its flagship brand Fortune, which produces cooking oil, wheat flour, rice, and sugar. The company posted consolidated revenue of Rs 51,555 crore last fiscal year as on date. At the last update, it also reported a market capitalization of ₹42,000 crore.

UltraTech Cement and Ambuja Cements
Future of Cement in India: Key Updates and 2025 Growth Outlook

The Indian cement industry is poised for growth in 2025, expecting improved sales realizations, higher margins, and accelerated demand. This optimism is largely fuelled by government infrastructure spending and the ongoing consolidation within the industry, driven by two major players: UltraTech Cement (part of the Aditya Birla Group) and Ambuja Cements (led by billionaire Gautam Adani). 

Key Developments in the Cement Sector: 

  • Acquisitions and Capacity Expansion: Both UltraTech Cement and Adani’s Ambuja Cements are making substantial investments to expand their market share. Together, they are acquiring over 50 million metric tons per annum (MTPA) capacity for approximately USD 4.5 billion. Adani Cement, which entered the sector relatively recently, has significantly expanded its footprint by acquiring several cement companies, including Saurashtra-based Sanghi Industries and Penna Industries, and a recent agreement to acquire CK Birla Group’s Orient Cement. With these acquisitions, Adani Cement crossed a 100 MTPA capacity, and plans are in place to reach 140 MTPA by FY28, nearly matching UltraTech Cement’s 156.66 MTPA capacity. 
  • Consolidation and Industry Leadership: The cement sector is seeing increased consolidation, with UltraTech Cement and Ambuja Cements collectively controlling a significant portion of India’s cement production capacity. In fact, the top five cement producers now account for approximately 60–65% of the industry’s total capacity. UltraTech Cement, aiming to maintain its lead, plans to reach 200 MTPA capacity by FY27, underscoring its aggressive growth strategy. 

Industry Challenges and Trends in 2024: 

  • Declining Cement Prices: The first half of FY25 saw a 10% year-on-year decline in cement prices, with the average price dropping from Rs 365 per bag in FY24 to Rs 330 per bag. This price drop reflects challenges within the industry, including moderate capacity utilization and lower sales realizations. Despite this, cement prices recovered on a month-to-month basis, rising by 2% in September 2024 compared to the previous month. 
  • Lower Growth in 2024: Cement industry growth in 2024 slowed to around 4.5–5.5%, compared to a more robust 10% growth in previous years. This slowdown was attributed to several factors: A prolonged heatwave and labour shortages during general elections. Seasonal monsoon disruptions that affected construction activity. 
  • Capacity Utilization and Volumes: Capacity utilization levels remained moderate at 70%, as several players struggled with underutilized capacity due to slow growth in demand and the impact of low cement prices. However, the industry’s outlook for the second half of FY25 is more optimistic, with expectations of a 4-5% increase in cement volumes driven by higher rural consumption, increased urban housing demand, and a boost in government infrastructure spending. 

Outlook for 2025 and Beyond: 

  • Government Infrastructure Push: A significant boost to the sector is expected from the government’s increased expenditure on infrastructure projects. This is anticipated to drive a rise in cement demand, especially in the housing and rural sectors. The industry’s growth is also being supported by higher capital expenditure from both the government and private sector players, which is likely to result in greater cement consumption. 
  • Capacity Additions and Expected Growth: The Indian cement industry is adding 35 MTPA of capacity in FY25, with an additional 70-75 MTPA capacity expected to come online in FY25-26. Despite this, overall capacity utilization is expected to remain moderate at 70% due to a lag in demand catching up with supply. The Cement Manufacturers’ Association (CMA) forecasts that cement volumes will grow by 4-5% year-on-year, reaching 445-450 million MT in FY25. 
  • Industry Transformation: The cement industry is undergoing a transformation, driven by a growing emphasis on sustainability, innovations, and increased demand for both housing and infrastructure. The Indian cement market, which now has a total capacity of 690 million tonnes, is expected to see improved price realizations and better capacity utilization in the coming years. 
Stove Kraft Limited stock report
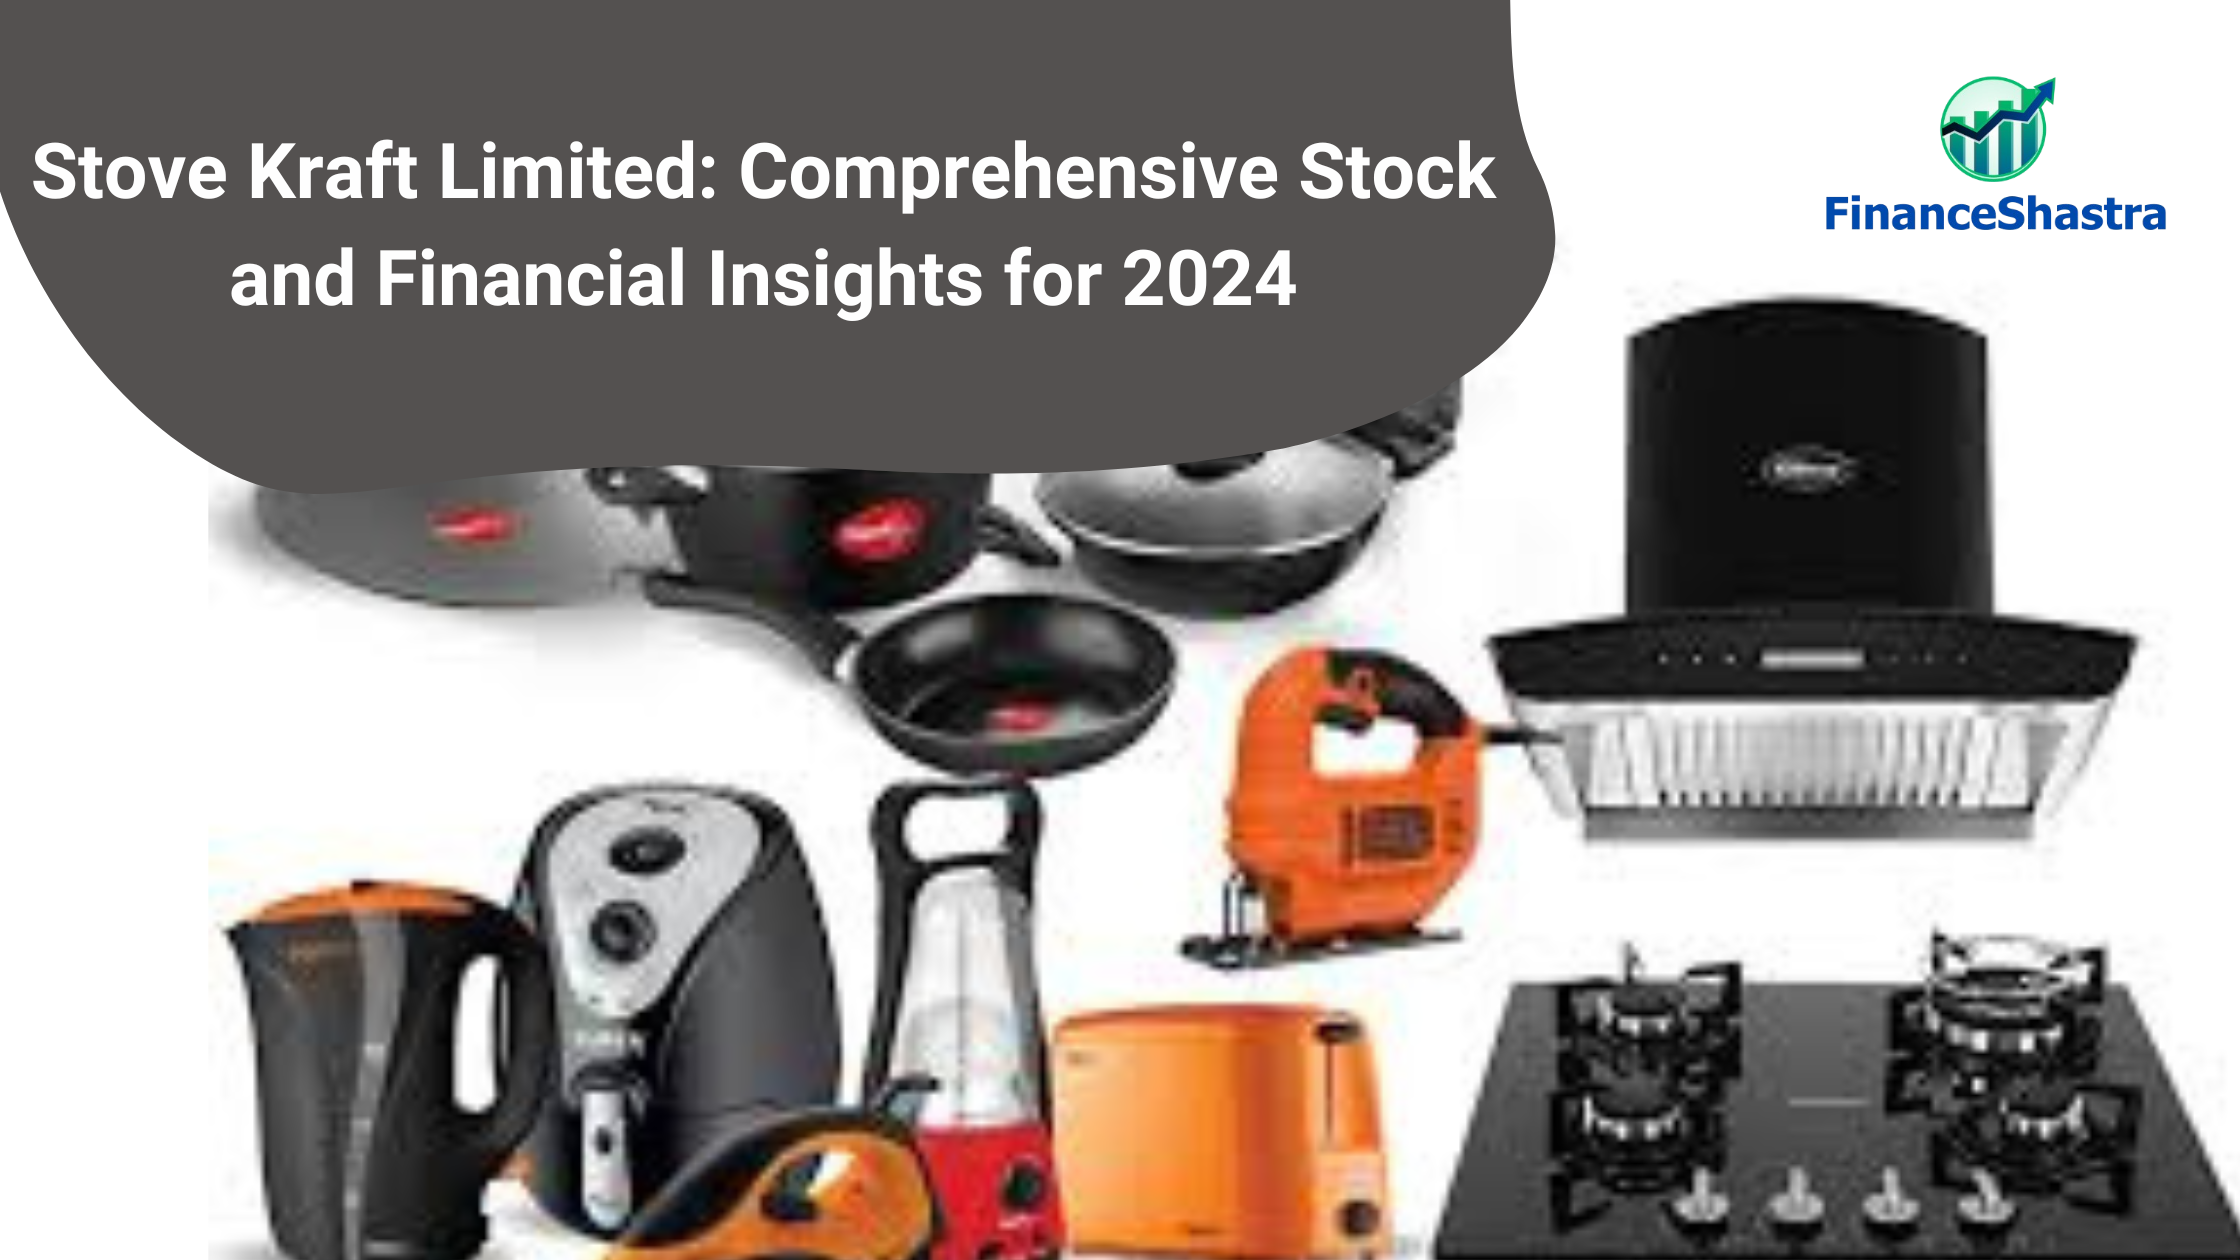
Stove Kraft Limited: Comprehensive Stock and Financial Insights for 2024

Company Overview

Stove Kraft Limited, headquartered in Bangalore, is a leading player in the Indian kitchen appliances market. The company designs, manufactures, and distributes a wide range of kitchen solutions, including pressure cookers, non-stick cookware, gas stoves, mixer grinders, and other small appliances. With strong brands like Pigeon, Gilma, and Black Decker, Stove Kraft has established a significant market presence, catering to both the premium and value-conscious consumer segments. 

The company operates through a pan-India distribution network of over 45,000 retail outlets and exports to 14 countries, focusing on innovation, quality, and affordability to drive growth in domestic and international markets. 

Key Stock Metrics 

  • Market Capitalization: ₹2,962 crore, reflecting the company’s significant valuation in the kitchen appliances sector. 
  • Current Stock Price: ₹896, trading near its 52-week high. 
  • 52-Week High/Low: ₹968 (high) and ₹410 (low), showcasing substantial price appreciation over the past year. 
  • Price-to-Earnings (P/E) Ratio: 86.3, indicating a premium valuation compared to industry peers. 
  • Book Value per Share: ₹138, reflecting the net asset value attributable to each share. 
  • Dividend Yield: 0.28%, offering modest returns to investors through dividends. 
  • Return on Capital Employed (ROCE): 11.3%, indicating efficient use of capital in generating returns. 
  • Return on Equity (ROE): 8.32%, highlighting the profitability relative to shareholder equity. 
  • Face Value: ₹10.0 per share, serving as the nominal value of the stock. 

Financial Highlights 

Stove Kraft Limited has achieved a remarkable financial transformation, evolving from losses in earlier years to sustained profitability since FY2019. The company’s steady revenue growth, from ₹377 crore in FY2013 to ₹1,420 crore in FY2024 (TTM), reflects strong demand for its kitchen appliances and successful market expansion. Enhanced operational efficiencies have driven an improvement in Operating Profit Margins (OPM) to 10% in FY2024, while net profits have stabilized at ₹34 crore, despite peaking at ₹81 crore in FY2021. The initiation of dividend payouts in FY2023 underscores the company’s financial stability and commitment to shareholder returns. Its balance sheet further highlights robust growth, with equity capital increasing to ₹33 crore and reserves transitioning from negative to ₹423 crore as of September 2024. Investments in fixed assets and capital work in progress (CWIP) demonstrate the company’s focus on scaling operations and infrastructure. While liabilities, particularly borrowings, have risen to ₹1,252 crore, these have been channelled toward productive growth initiatives. Stove Kraft’s ability to maintain this trajectory in a competitive market will depend on continued innovation, efficient capital utilization, and strategic expansion efforts. 

Competitive Strengths 

  • Strong Brand Portfolio: Market leadership with well-recognized brands like Pigeon and Black Decker catering to diverse consumer needs. 
  • Wide Distribution Network: Presence in over 45,000 retail outlets ensures extensive reach across urban and rural areas. 
  • Export Growth: Expansion into international markets with a focus on Middle Eastern and South Asian regions. 
  • Product Innovation: Continuous R&D efforts to develop energy-efficient and user-friendly appliances. 
  • Cost-Efficient Manufacturing: In-house production capabilities reduce reliance on third-party suppliers, maintaining competitive pricing. 

Risks and Challenges 

  • Raw Material Price Volatility: Dependency on raw materials like aluminium and stainless steel could impact margins.  
  • Intense Competition: Competes with well-established brands like Prestige, Butterfly, and Hawkins in a highly competitive market. 
  • Economic Sensitivity: Changes in consumer spending patterns, particularly in discretionary categories, may affect demand. 
  • Supply Chain Disruptions: Reliance on global supply chains for certain components could pose risks during geopolitical or logistical challenges. 

Growth Outlook 

  • Domestic Market: Increased urbanization and rising disposable incomes are expected to drive demand for premium kitchen appliances. 
  • International Expansion: Stove Kraft aims to strengthen its global footprint by entering new markets in Europe and Africa. 
  • Product Diversification: Plans to expand its product portfolio into smart kitchen solutions and energy-efficient appliances. 
  • E-Commerce Growth: Leveraging online platforms to enhance accessibility and cater to tech-savvy consumers. 

Recommendation:

Stove Kraft Limited’s stock performance reflects strong market confidence, with its current stock price at ₹892.30, trading close to its 52-week high of ₹950, indicating sustained investor interest. The stock’s 52-week low of ₹750 highlights resilience amidst market fluctuations. With a target price of ₹970 for FY25, analysts project a potential upside driven by the company’s robust financial performance, strategic growth initiatives, and continuous product innovation. Stove Kraft’s focus on expanding its market share in the kitchen appliances sector positions it as a compelling choice for long-term investors, with significant potential for value appreciation as demand in the segment continues to grow. 

Paras Defence and Space Technologies
Paras Defence and Space Technologies: Growth Story, Future Prospects

Company Overview 

Paras Defence and Space Technologies Limited (Paras Defence) is a leading Indian company specializing in the design, development, manufacturing, and testing of defense and space engineering products and solutions. Headquartered in Navi Mumbai, the company plays a critical role in supporting India’s defense and space sectors with cutting-edge technologies. 

Founded in 2009, Paras Defence operates in highly specialized areas such as optoelectronics, defense electronics, and electromagnetic pulse (EMP) solutions. With a focus on indigenization, the company aligns with the Government of India’s “Make in India” and “Aatmanirbhar Bharat” initiatives. Paras Defence collaborates with global and domestic organizations, making it a key player in India’s strategic sectors. 

Shareholding Pattern  

Business Segments and Products 

Paras Defence operates through the following key business segments: 

  • Defense and Space Optics: Offers high-precision optics for satellites, drones, and defense surveillance applications. Supplies lenses and mirrors for electro-optic systems. 
  • Defence Electronics: Specializes in manufacturing rugged electronic systems for defense applications. Provides displays, consoles, and power distribution units for naval and land defense. 
  • Electromagnetic Pulse (EMP) Solutions: Designs EMP protection systems for critical defense and infrastructure installations. Ensures operational continuity during electromagnetic attacks. 
  • Heavy Engineering: Engages in the manufacturing of high-complexity components for defense and aerospace systems. 
  • Additive Manufacturing and 3D Printing: Supports rapid prototyping for defense and aerospace applications using advanced 3D printing technologies. 

Financial Performance 

Paras Defence has demonstrated consistent growth, driven by its specialization in niche markets. Key highlights include: 

Revenue Growth: Revenue has seen an upward trajectory due to increased defense spending and new contract acquisitions. The company has also expanded its footprint in the global space systems market. Q2 FY25 revenue stood at ₹87.09 crore, reflecting a 42.05% YoY growth. Annual revenue for FY24 reached ₹254 crore, marking a 13.87% YoY increase​. 

Profitability Metrics: Paras Defence’s EBITDA and net profit margins are reflective of its high-value offerings and operational efficiency. Net profit margins are strong at 13.72% for FY24. The company has shown consistent revenue and profit growth, positioning it for long-term stability. 

Market Metrics: The current market capitalization of Paras Defence is ₹4,423 crores, and the company generates approximately ₹7.53 lakhs in revenue per employee, demonstrating strong operational efficiency​. 

  • Order Book: The company boasts a robust order book, providing visibility for sustained growth over the next few years. 

Technological Capabilities 

Paras Defence has established itself as a technology-driven company with strong capabilities in: 

  • Optoelectronics: Expertise in optical components critical for surveillance and reconnaissance. 
  • Indigenous Manufacturing: Pioneering solutions aligned with India’s defense modernization goals. 
  • Advanced Testing Facilities: State-of-the-art facilities for testing components under extreme environmental conditions. 
  • R&D Focus: Significant investment in research and development to maintain technological superiority. 

Recent Developments and Market Position 

  • Strategic Partnerships: Collaborations with DRDO (Defence Research and Development Organization), ISRO (Indian Space Research Organization), and other leading entities enhance Paras Defence’s market standing. Partnerships with international firms for technology transfers and co-development projects. 
  • IPO Success (2021): Paras Defence raised funds through a successful IPO, signaling investor confidence in its business model and future prospects. 
  • Global Expansion: Increased export of defense systems and components to international clients. 
  • Government Initiatives: Active beneficiary of policies promoting indigenization of defense production. 

Future Outlook 

  • Market Trends: The Indian defense sector is projected to grow significantly, with increased budget allocations and a focus on reducing import dependency. Paras Defence is poised to benefit from these trends. 
  • Growth Drivers: Expansion into newer segments like unmanned aerial systems and space-grade components. Participation in mega-projects like India’s lunar and Mars missions. 
  • Challenges: Competition from global defense giants and stringent regulatory frameworks. 

Comparative Analysis 

When benchmarked against peers like Bharat Electronics Limited (BEL) and Data Patterns, Paras Defence has carved a unique niche with its focus on EMP solutions and optoelectronics. However, its smaller scale and dependency on government projects could be potential constraints compared to larger players. 

Metric Paras Defence BEL Data Patterns 
Revenue Growth Higher in niche Moderate in broad base High in electronics 
Technological Expertise Specialized Diverse Moderate 
Export Contribution Growing Established Emerging 

Stock Performance and Target 

  1. Recent Performance: The stock is currently trading at ₹1,078 (as of December 2024), with a 52-week high of ₹1,592.7 and a low of ₹610. YTD gain: +52.68%, showcasing strong investor confidence. 
  2. Target for FY25: Analysts predict a moderate rise of 0.41% to 1.12% by year-end, with targets between ₹1,102 and ₹1,110. Long-term potential: Analysts remain optimistic about the company’s prospects, supported by robust government defense spending and export growth. 
    Mutual Funds-ETFs at a Premium
    Mutual Funds Sound Alarm on Buying International ETFs at a Premium

    Fund houses and wealth managers are raising concerns about the rising trend of investors purchasing international exchange-traded funds (ETFs) trading at significant premiums to their net asset value (NAV). The caution comes amidst a surge in interest among Indian investors seeking exposure to global markets, particularly the U.S., following Donald Trump’s recent victory in the U.S. Presidential election. 

    International ETFs, designed to provide investors with access to foreign markets, are seeing a mismatch in demand and supply due to regulatory restrictions on the creation of new units. This imbalance has caused many ETFs, especially those tracking U.S. markets, to trade at premiums well above their NAVs. Experts warn that such buying behaviour could lead to disappointing returns when the premium diminishes, and the ETF’s market price aligns with its underlying NAV.

    What Are ETFs, and Why the Premium?

    ETFs are passively managed investment instruments that track indices, commodities, or baskets of securities, offering low expense ratios compared to mutual funds. They are traded on exchanges like stocks, allowing investors to enter or exit positions throughout the trading day. Fund houses typically appoint market makers to provide liquidity, and large investors can approach fund houses for unit creation or redemption. 

    However, a demand-supply mismatch has emerged due to regulatory limitations on fresh unit creation in international ETFs. This has led to existing units being in short supply, driving up their prices on exchanges relative to their NAV.

    Industry Experts Weigh In

    Prateek Bhardwaj (hypothetical name), an experienced wealth manager, explained the risk: 
    “Investors need to understand that paying a premium over NAV is essentially overpaying for the asset’s intrinsic value. When the market price converges with the NAV, it could result in losses or reduced returns. This is particularly risky for investors eyeing short-term gains.” 

    Another mutual fund executive noted, “The current premiums are a result of pent-up demand for global diversification, especially in the U.S. market, where optimism has risen post-election. However, without new units being created to meet this demand, the price distortion will persist.” 

    The Risks of Buying at a Premium 

    Purchasing ETFs at a premium means that investors are essentially paying more for the same value of underlying assets. Over time, as supply stabilizes or investor interest wanes, the ETF’s market price may decline to align with the NAV. This convergence can erode investor returns, particularly for those who bought during periods of inflated demand. 

    What Should Investors Do? 

    Wealth managers and fund houses recommend a cautious approach: 

    1. Monitor NAV and Market Price: Investors should ensure that they are not overpaying for ETFs by comparing the market price with the NAV before making a purchase. 
    2. Evaluate Long-Term Goals: International ETFs are best suited for long-term diversification. Short-term investments, especially during periods of price premiums, could result in suboptimal returns. 
    3. Be Patient: Experts suggest waiting for market corrections or fresh unit creations to stabilize prices, reducing the risk of buying at inflated levels. 
    4. Seek Professional Advice: Investors uncertain about their strategies should consult financial advisors to assess the suitability of international ETFs for their portfolios. 

          Why the Renewed Interest in U.S. ETFs? 

          The U.S. market has attracted renewed attention from Indian investors due to its robust economic performance, diversification benefits, and perceived growth potential following the recent political changes. ETFs tracking major U.S. indices, such as the S&P 500 or Nasdaq-100, are seen as effective vehicles for accessing these opportunities. 

          However, experts emphasize that such investments require due diligence. While the demand for global diversification is a positive trend, overpaying for these instruments during times of supply constraints could undermine the very benefits they offer. 

          Conclusion 

          International ETFs offer a valuable opportunity for Indian investors to diversify their portfolios and gain exposure to global markets. However, the current scenario of ETFs trading at a premium to NAV calls for restraint. Investors must prioritize research and avoid impulsive decisions driven by market trends. By focusing on long-term strategies and understanding the dynamics of ETF pricing, investors can maximize their returns while minimizing unnecessary risks. 

          Bharat Earth Movers Ltd.
          Is Bharat Earth Movers Ltd. (BEML) the Next Big Investment Opportunity?

          Company Overview 

          Bharat Earth Movers Ltd. (BEML), headquartered in Bengaluru, India, is a leading public sector undertaking under the Ministry of Defence. Established in 1964, BEML has evolved into a diversified engineering powerhouse, catering to critical sectors including defense, railways, and construction. The company plays a pivotal role in India’s infrastructure and defense development. BEML is a key supplier of military equipment to the Indian armed forces, producing high-mobility vehicles, tank transporters, and missile launchers. BEML offers a comprehensive range of heavy-duty machinery for mining and construction projects, including dump trucks, bulldozers, excavators, and loaders. BEML has a strong domestic footprint and is steadily expanding its international presence, with exports to over 68 countries. 

          Return Summary 

          YTD 1 Month 6 Month 1 Year 2 Year 3 Year 5 Year 
          57.82% 9.05% 10.47% 82.19% 190.46% 129.85% 353.97% 

          3 Year Return: BEML v/s NIFTY50 

          Result & Business Highlights 

          • Revenue for YoY and QoQ is at increasing phase at Q2 FY25 revenue of ₹860 crore with a moderate EBITDA margin of 8% at ₹73 crore. 
          • Business segments contribution is Defence & Aerospace 19%, Mining & Construction 43% and Rail & Metro 38%. 
          • BEML exports over 1400+ equipment to 72 countries; railway products are exported to the SAARC region. 
          • Export turnover in FY20 was ₹463 crores, which is now over ₹1066 crores in FY24 and is ₹196 crore in Sep 2024.
          • Major accomplishment of BEML are 350 armoured vehicles, 3560 military wagons, 2000 metro cars and 18000 rail coaches.
          • The company has won new contracts worth ₹136 crore and ₹83 crore from the Ministry of Defence. 

          Shareholding Pattern 

          Return Comparison with Peers 

          COMPANY 1 Year 2 year 3 Year 5 Year 
          BEML 82.19% 190.46% 129.85% 353.97% 
          Hindustan Aeronautics 66.55% 241.84% 612.54% 1123.19% 
          Bharat Dynamics 78.41% 156.77% 501.51% 750.86% 
          Paras Defence 58.46% 81.63% 53.49% – 
          MTAR Technologies (23.53%) 3.52% (27.29%) – 

          Contribution to Industry Size 

          The Indian defence manufacturing sector is valued at approximately $12 billion, with a goal to reach $25 billion by 2025 under the government’s “Make in India” initiative. BEML is a critical supplier of high-mobility vehicles, tank transporters, missile launchers, and ground support equipment. The company supports over 40% of the market for high-mobility military vehicles, positioning it as a key enabler of indigenous defence manufacturing. The Indian mining and construction equipment market is valued at around ₹25,000 crore (~$3 billion), with steady growth driven by infrastructure investments. The Indian railways and metro rail systems are part of a $20 billion industry, with significant investments in urban transit expansion. It holds a dominant position in metro coach manufacturing, supplying vehicles for major cities like Delhi, Bengaluru, and Mumbai. 

          Balance Sheet Analysis 

          • Reserves are stable at ₹2038 crore from FY21 to ₹2650 crore with high revenues and efficient management operations to ₹4054 crore in FY24. 
          • Borrowing has reduced year on year, makes no worry. 
          • Trade receivables are increasing makes a worry for company in collection of income form government. 

          Cash Flow Analysis

          • Cash flow from Operations is ₹560 crores in FY23 and ₹458 crores in FY24. 
          • The Company has purchased fixed assets worth ₹101 crore in FY24, shows a great sign of expansion. 
          • Company is paying dividends continuously every year to its shareholders, shows a positive sign of stable company.