Max Healthcare Institute Ltd. (MHIL) is one of India’s leading providers of healthcare services, known for its comprehensive and integrated approach to healthcare. Established in 2000 and headquartered in New Delhi, MHIL operates a network of hospitals and healthcare facilities that deliver world-class medical services. The company has a significant presence in North India and offers a wide range of services across multiple medical disciplines. MHIL operates 17 healthcare facilities, including tertiary and quaternary care hospitals, primary care clinics, and specialized centers. Its flagship hospitals include Max Super Speciality Hospitals in Saket, Patparganj, and Shalimar Bagh in Delhi-NCR. Max Healthcare aims to continue its leadership in the Indian healthcare sector by expanding its capacity, investing in cutting-edge technology, and enhancing its presence in underserved markets.
Return Summary
YTD
1 Month
6 Month
1 Year
2 Year
3 Year
5 Year
59.84%
5.01%
33.4%
60.59%
150.66%
189.16%
–
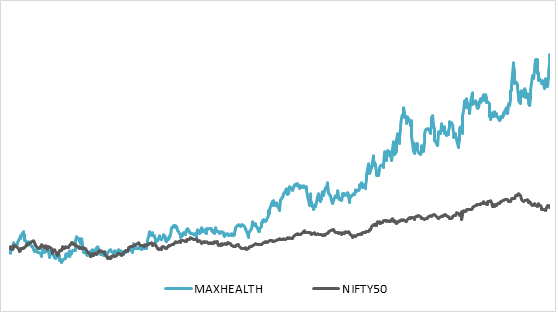
3 Year Return: MAXHEALTH v/s NIFTY50
Result & Business Highlights
Revenue for YoY and QoQ is at increasing phase at Q2 FY25 revenue of ₹1707 crore with moderate EBITDA margin of 26% at ₹451 crore.
Average Revenue per Occupied Bed (ARPOB) for Q2 was ₹76,100, with a growth of 7% for existing hospitals.
Newly operational Max Dwarka hospital reported revenue of ₹33 crore, EBITDA loss of ₹18 crore, 41% occupancy, and ARPOB of ₹80,000; expected to break even before year-end.
Acquisition of Jaypee Hospital, Noida, valued at ₹1,660 crore, anticipated to enhance presence in the National Capital Region; plans to increase operational bed capacity from 376 to 430 by March 2025.
Ongoing expansions include 140 beds at Nagpur, 268 beds at Nanavati, 400 beds at Max Smart, 155 beds at Mohali, and 501 beds at Sector 56 Gurgaon, all on schedule.
Max Home reported a revenue of ₹53 crore, a growth of 24% YoY, offering 14 specialized service lines across 12 cities.
Max Lab generated gross revenue of ₹47 crore, reflecting a strong growth of 21% YoY, with over 1,100 collection centers
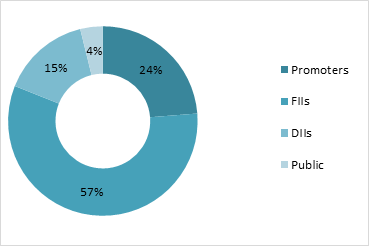
Shareholding Pattern
Return Comparison with Peers
COMPANY
1 Year
2 year
3 Year
5 Year
Max Healthcare
60.59%
150.66%
189.6%
–
Apollo Hospitals
30.37%
52.24%
33.91%
390.48%
Fortis Healthcare
78.88%
141.12%
143.11%
403.41%
Aster DM Healthcare
20.4%
111.31%
151.8%
212.8%
Narayana Hrudayalaya
8.35%
73.5%
129.73%
341.5%
Contribution to Industry Size
Max Healthcare is one of the largest healthcare companies, contributed a lot to its industry and to India. The underpenetration of hospital beds and demand supply gap is reduced and the insurance penetration in healthcare sectors is rising from 32% in FY17 to 41% in FY24. The operations or any surgery procedure cost in India is approximately 70% – 90% discount to average global cost. The increasing use of latest technology in the treatment process has benefited the healthcare industry be efficient and useful in cost cutting also. The occupancy of Max Healthcare is approx. 75%, while others in industry are at average of 65%.
Balance Sheet Analysis
Reserves have increased very significantly from FY21 with high revenues and efficient management operations to ₹7436 crore in FY24.
Borrowing has increased year on year but in significant manner, makes no worry.
The cash on balance sheet is enough to pay dividends regularly and carry on every day operations easily.
The fixed assets has increased to ₹9506 crore, as company is investing a lot in expanding beds, medical equipments, land acquisitions for new hospital branches.
Cash Flow Analysis
Cash flow from Operations is positive for many years and in FY24 it is ₹1122 crore.
The Company has purchased fixed assets worth ₹786 crore in FY24, shows a great sign of expansion.
Max Healthcare has now started paying dividends to its shareholders as it has now enough cash reserves.
State Bank of India: A Leading Multinational Banking Institution
Established on July 1, 1955, following the nationalization of the Imperial Bank of India, the State Bank of India (SBI) is India’s largest multinational public sector bank, headquartered in Mumbai. Formed with the Reserve Bank of India initially acquiring a 60% stake, SBI has grown into a cornerstone of the Indian financial system.
SBI offers a comprehensive range of financial solutions through four primary segments: Treasury, Corporate/Wholesale Banking, Retail Banking, and Other Banking Business. Its extensive network, consisting of over 22,000 branches across India and 227 international offices in 30 countries, supports global financial operations from hubs like New York, Tokyo, and London. As a leader in digital innovation, SBI has introduced initiatives like SBI e-tax for online tax payments and the Virtual Debit Card, enhancing customer security and convenience.
The bank has experienced significant growth and expansion through strategic acquisitions, notably the 2017 merger with five associate banks and the Bharatiya Mahila Bank, which solidified its domestic dominance. Internationally, SBI has forged global collaborations, including a Payments Bank partnership with Reliance Industries and ventures with Visa and Elavon for merchant acquiring services. Its subsidiaries, such as SBI Life Insurance, a joint venture with Cardif S.A., and SBI Funds, recognized as ‘Mutual Fund of the Year,’ underscore its excellence in insurance and asset management.
SBI actively supports national development initiatives through specialized products like the Defence Salary Package and senior citizen loans. By leveraging technology-driven services, it ensures seamless financial solutions for customers across both urban and rural areas. With its strong domestic foundation and growing international presence, SBI continues to cement its role as a leader in the global banking sector.
Returns Summary
YTD
1 Month
6 Month
1 Year
2 Year
3 Year
5 Year
33.02%
4.01%
-5.72%
49.33%
40.56%
80.46%
154.00%
Result Highlights
State Bank of India (SBI) demonstrated a strong performance in Q2FY25, showcasing growth in profitability, business expansion, asset quality, and digital transformation. The bank reported a Net Profit of ₹18,331 crores, reflecting robust earnings. Key profitability metrics like Return on Assets (ROA) at 1.13% and Return on Equity (ROE) at 21.78% for H1FY25 underscore efficient capital utilization, while the Net Interest Margin (NIM) of 3.18% (3.31% domestic) highlights sustainable profitability.
SBI’s business growth remained impressive, with deposits crossing ₹51 trillion, up 9.13% YoY, and advances exceeding ₹39 trillion, registering a 14.93% YoY growth. This reflects balanced expansion across deposits and credit segments, positioning SBI for competitive market share growth. Asset quality improved significantly, with Gross NPA at 2.13% and Net NPA at 0.53%, supported by a Provision Coverage Ratio (PCR) of 75.66%, rising to 92.21% when including AUCA. Additionally, the bank maintained conservative provisioning, setting aside ₹31,084 crores, equivalent to 153% of Net NPAs, ensuring resilience against potential losses.
SBI’s digital transformation continues to lead, with >98% of transactions via alternate channels and over 8.13 crore users on its YONO app. Notably, 61% of savings accounts were opened digitally in Q2FY25, highlighting the platform’s pivotal role in customer acquisition and engagement. The bank’s liability franchise benefits from its 22% market share in deposits, with 10.05% YoY growth in current account balances, and a credit-to-deposit ratio of 67.87%, reflecting healthy lending activity.
To support future growth, the Central Board approved raising up to ₹20,000 crores in long-term bonds in FY25. This capital infusion, through public or private placement, will enhance the bank’s capital base, supporting its strategic goals of credit expansion and financial stability, while sustaining a balanced credit-to-deposit ratio. These initiatives position SBI for stable, long-term growth in a competitive banking landscape.
Shareholding Pattern
Return Comparison with Peers
Company
ROCE
6 Months
1 Year
3 Year
5 Years
State Bank of India
6.16%
4.53%
43.59%
21.75%
20.49%
Bank of Baroda
6.33%
-5.34%
21.77%
42.16%
20.01%
Punjab National Bank
5.46%
-12.86%
28.92%
41.02%
11.63%
IOB
5.41%
-18.30%
32.48%
37.16%
39.38%
Union Bank of India
6.55%
-12.79%
10.39%
39.99%
16.74%
Canara Bank
6.63%
-10.92%
23.11%
36.54%
19.29%
Indian Bank
5.92%
6.88%
41.61%
59.60%
36.32%
SBI Outlook and Contribution to Industry
State Bank of India (SBI) stands as a cornerstone of the Indian banking sector, with a ₹52 lakh crore balance sheet and a 22% market share in deposits. It dominates segments like home loans (26.5%) and auto loans (19.8%), supported by its 22,000 domestic branches and operations in 30 countries. SBI’s YONO digital platform drives innovation, handling 66 crore transactions annually, reflecting its leadership in technology-driven banking.
The industry outlook for FY25 and beyond is positive, with GDP growth at 6.7% in Q1 FY25, stable global conditions, and robust banking sector projections of 11-12% deposit growth and 12-13% credit growth. SBI leads this momentum, achieving ₹51.17 trillion in deposits and 14.93% credit growth YoY, backed by a strong capital adequacy ratio of 13.76% and high asset quality (Gross NPA at 2.13%).
Digital transformation remains a key driver, with over 8 crore digital users and 61% of savings accounts opened digitally in Q2 FY25. Its subsidiaries, such as SBI Life Insurance and SBI Funds, diversify its revenue streams, bolstering financial stability.
SBI’s focus on sustainable growth, digital innovation, and robust asset management positions it to capitalize on India’s economic momentum, ensuring long-term leadership and enhanced shareholder value.
Balance Sheet Analysis
SBI’s balance sheet from FY20 to FY24 shows steady expansion in key financial areas. Deposits grew from ₹32,74,160.63 crores to ₹49,66,537.49 crores, reflecting the bank’s strong customer base and competitive edge in attracting funds. Simultaneously, advances saw a significant rise, from ₹23,74,311.18 crores to ₹37,84,272.67 crores, driven by robust growth across corporate, retail, and MSME sectors. The bank has also shown consistent growth in reserves, increasing from ₹2,50,167.66 crores to ₹4,14,046.71 crores, indicating a strong capital base to support long-term sustainability. Borrowings grew from ₹3,32,900.67 crores to ₹6,39,609.50 crores, signifying
SBI’s use of external funding to drive its growth. While this increase reflects SBI’s expansion, effective asset-liability management remains critical. Investments and other assets also rose significantly, supporting SBI’s diversified portfolio. The net block remained stable, reflecting a balanced approach to capital expenditure in fixed assets. With strong asset growth and prudent liability management, SBI is well-positioned for continued market leadership in India’s banking sector, strengthened by its digital transformation through platforms like YONO.
Cash Flow Analysis
SBI’s cash flow analysis from FY2013 to FY2024 reveals significant fluctuations in its operational, investing, and financing activities. Operating cash flows have been largely positive, with notable spikes in FY2017 (+₹77,406 crores) and FY2022 (+₹89,919 crores), reflecting strong operational efficiency. However, negative flows in FY2018 and FY2023 highlight challenges such as higher provisioning for bad loans. In terms of investing activities, cash flows have consistently been negative, with the bank investing heavily in growth, technology, and acquisitions. A rare positive period in FY2018 likely reflects asset disposals. Financing activities show volatility, with positive cash inflows in certain years due to capital raising and negative flows in others, such as FY2024, likely reflecting debt repayments and a focus on capital strengthening. Despite these fluctuations, SBI has managed to maintain positive net cash flow in key years, ensuring liquidity for growth. Overall, SBI’s cash flow patterns reflect strategic financial management, including debt reduction and investment in expansion, positioning it for long-term growth.
Sonata Software Ltd. is a leading global IT services and technology solutions company based in India. It provides a wide array of IT services, software solutions, and digital transformation offerings to enterprises worldwide. With a focus on innovation and customer-centricity, the company caters to industries such as retail, manufacturing, travel, ISV (Independent Software Vendors), and BFSI (Banking, Financial Services, and Insurance). It has business segments in IT services, platformation, Product Engineering, and software Distributors. It has a global presence with operations in over 35 countries, serving more than 500 clients.
Return Summary
YTD
1 Month
6 Month
1 Year
2 Year
3 Year
5 Year
(15.73%)
4.75%
15.07%
(0.15%)
113.87%
111.02%
444.02%
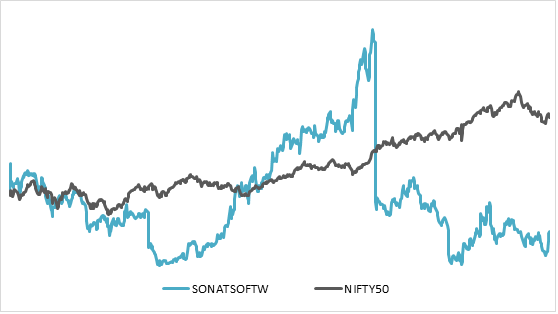
3 Year Return: Sonata Software v/s NIFTY
Result Highlights
Revenue for YoY and QoQ is at increasing phase at Q2 FY25 revenue of ₹2527 crore with moderate EBITDA margin of 7% at ₹176 crore.
The target revenue company want to achieve is ₹12,000 crore by the end of 2027, and strengthening its client partnerships with Microsoft, AWS and other significant players.
In this half year company has closed 6 large deals, and in active pipeline 49% are large orders.
The cash reserves on balance sheet has reduced from ₹700 crore to ₹500 crore, because of dividend payouts and acquisitions.
Major wins in Q2 are Collaboration with a US technology giant for AI, cloud, and data services. A multi-year data modernization program with an Australian wholesaler. Strategic partnership with a leader in food safety systems for consumer-facing automation platforms
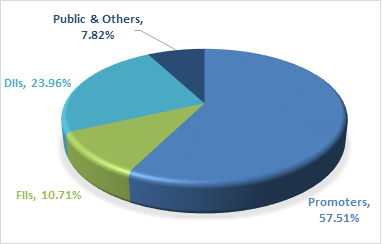
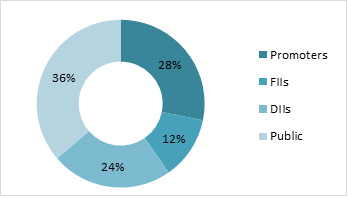
Shareholding Pattern
Return Comparison with Peers
COMPANY
1 Year
2 year
3 Year
5 Year
Sonata Software
(0.15%)
113.87%
111.02%
444.02%
Tata Elxsi
(19.7%)
(1.86%)
14.26%
734.5%
KPIT Technology
(8.12%)
91.47%
196.3%
1341.6%
Newgen Software
75.56%
560.6%
319.2%
1176.5%
Birlasoft
(3.44%)
97.15%
25.32%
745.02%
Contribution to Industry Size
The great partnership for 30+ years of Sonata with Microsoft in the AI industry has helped Sonata grow significantly. It is helping Microsoft with 400+ clients across the globe generating Microsoft’s $650+ million revenue per annum. It has 3500+ teams on Microsoft Technologies, contributing in the industry of healthcare, retail, manufacturing, and Telecom. For corporates, it has made its own AI called Harmoni. AI with Microsoft and AWS as partners.
Balance Sheet Analysis
Reserves have been increasing gradually with high revenues and efficient management operations.
Borrowing has increased year on year to fulfil the expansion and partnerships with clients for projects.
The cash reserves are enough to pay the borrowed debts and acquisitions of companies to grow inorganic way.
The balance sheet is strong and efficient in industry aspects.
Cash Flow Analysis
Cash flow from operations is ₹281 crore in FY24 and is positive for many years.
The acquisitions have increased in the past 2-3 years because of high demand in the industry, showing great strength in the company.
The borrowing has been stable and is very low, maintaining its debt-to-equity ratio.
The company is paying its dividend every year constantly with good payouts to its investors.
UltraTech Cement Ltd., a flagship company of the Aditya Birla Group, is India’s largest manufacturer of grey cement, ready-mix concrete (RMC), and white cement. Established in 1983, the company has a strong presence across India, UAE, Bahrain, and Sri Lanka. UltraTech operates 23 integrated manufacturing units, 28 grinding units, and 7 bulk terminals, making it a leading player in the global cement industry. It has installed cement manufacturing capacity of approximately +140 million tonne per annum and has employee strength over 23000 in FY24. UltraTech is a pioneer in sustainability initiatives, with a focus on reducing carbon emissions, renewable energy adoption, and circular economy practices. It is committed to achieving carbon neutrality by 2050.
Return Summary
YTD
1 Month
6 Month
1 Year
2 Year
3 Year
5 Year
4.58%
-0.97%
7.91%
25.87%
59.37%
48.54%
155.7%
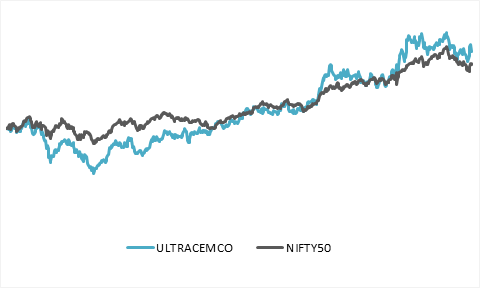
3 Year Return: UltraTech Cement v/s NIFTY
Result Highlights
Revenue of ₹15,635 in Q2 and EBITDA of ₹2017, which is multi quarter low because of monsoon season, election pressure and high cost compared to revenue.
UltraTech Cement’s capacity utilization at 68% with 3% growth in volume terms for Q2 FY25.
The high-cost fuel contracts are at end and by Q3 the prices will further go down and costs dropping to ₹1.84 per Kcal, down 8% QoQ.
Government focus on Metros, Roads, and Housing schemes will benefit cement companies.
The company will be expanding its capacity by 8 million tons reaching 158 million tons capacity.
The Kesoram Cement acquisition at ₹7500 crore, and it will strengthen and expand the south market footprint and will reach the target of total capacity of 200 million tons by 2028.
Shareholding Pattern
Return Comparison with Peers
COMPANY
1 Year
2 year
3 Year
5 Year
UltraTech Cement
26.03%
59.57%
48.72%
156.08%
Ambuja Cement
18.97%
(9.75%)
37.77%
150.30%
Shree Cement
(2.00%)
9.05%
(1.54%)
20.58%
JK Cements
16.05%
37.46%
27.79%
258.90%
JK Lakshmi Cements
(1.39%)
15.34%
23.17%
173.19%
Contribution to Industry Size
Being the largest cement company in Cement industry, UltraTech Cement with ₹318,000 crore market capitalizations having 24% market share of the industry. Expanding its footprint and having highest market share in North, South, West and East of India. Promoting the use of renewable energy resources for its production process and reducing the use of coal and pet coke. The company extensive operations include 23 integrated plants, 28 grinding units and 7 bulk terminals, enabling to serve the market efficiently.
Balance Sheet Analysis
Reserves, fixed assets and capex is increasing every year, showing a great sign of growth.
Company has debt on its balance sheet but has enough cash to pay it, hence it is net debt free.
The excess cash is used to acquire new business to have more growth through inorganic way as business is at mature stage to grow fast.
Cash Flow Analysis
Cash flow from Operations is ₹10,898 crore in FY24 and is positive for more than 10 years.
Purchase of fixed assets is in increasing trajectory every year on year, showing a great sign of expansion and growth of company.
The borrowing has been stable and is very low maintaining its debt to equity ratio.
India has earned the title of the “Pharmacy of the World” due to its unparalleled contributions to the global supply of affordable medicines, particularly during the COVID-19 pandemic. The country’s role in vaccine distribution and the production of essential drugs during this period has further cemented its reputation as the “Healers of the World.” These achievements highlight India’s critical role in addressing global healthcare needs by providing low-cost and high-quality medical solutions.
Current Industry Status
The Indian pharmaceutical industry, valued at $55 billion, is a key player in the global healthcare sector. It accounts for an impressive 20% of the world’s generic drug supply and fulfils 60% of the global vaccine demand, demonstrating its dominance in these areas. This success is attributed to India’s cost-effective manufacturing processes, skilled workforce, and strong infrastructure.
Future Projections
India’s pharmaceutical sector is set for remarkable growth, expected to reach $130 billion by 2030 and a staggering $1 trillion by 2047. This unprecedented expansion reflects the industry’s potential to transform into a global healthcare innovation hub. It will likely reinforce India’s leadership in drug discovery, manufacturing, and distribution, benefiting millions worldwide.
Global Growth Drivers
The following factors are driving India’s dominance in the pharmaceutical sector:
Low-Cost Manufacturing: India’s ability to produce high-quality drugs at lower costs makes it a preferred global supplier.
Growing Demand for Generics and Biopharmaceuticals: As healthcare costs rise worldwide, the demand for cost-efficient generic drugs and biosimilars is increasing.
Advanced Production Standards: Indian manufacturers adhere to strict quality protocols, earning trust in regulated markets like the US, Europe, and Japan.
Focus on Drug Innovation: India is actively advancing in biologics, innovative drug therapies, and active pharmaceutical ingredients (APIs).
Government Policies and Industry Initiatives
The Indian government is spearheading multiple initiatives to bolster the pharmaceutical industry:
PLI Schemes: Production Linked Incentives (PLI) are being provided to encourage domestic production of APIs and reduce dependency on imports from countries like China.
R&D Investments: Increased focus on research and development is helping India step into niche markets such as gene therapy and immunotherapy.
Industry Collaborations: Partnerships with global pharmaceutical companies are being encouraged to strengthen India’s competitive edge.
Impact on the Indian Stock Market
Sectoral Impact
The pharmaceutical sector is poised to see strong investor interest, with both domestic and international players looking to capitalize on the expected growth. The news is likely to create bullish momentum for pharmaceutical stocks, especially those focused on generics, vaccines, and biologics.
Key Beneficiaries
Major Companies: Sun Pharma, Dr. Reddy’s, Cipla, Biocon, Lupin, and Zydus Lifesciences are positioned to benefit significantly from this growth.
API Manufacturers: Companies like Divi’s Laboratories and Aarti Drugs are expected to gain as India moves towards greater self-reliance in API production.
Innovators: Firms investing in biosimilars, biologics, and cutting-edge research are likely to emerge as market leaders.
Long-Term Opportunities
The $1 trillion milestone by 2047 highlights the sector’s long-term potential, making it a compelling investment avenue for institutional and retail investors alikeBroader Implications for the Economy
Employment Generation: The pharmaceutical industry’s expansion will create millions of jobs across R&D, manufacturing, and logistics.
Boost to Exports: India’s export contribution is expected to grow significantly, further strengthening its foreign exchange reserves and global trade balance.
Healthcare Innovation Hub: With investments in biotechnology, clinical trials, and advanced drug discovery, India is on track to become a leading centre for healthcare innovation.
Conclusion
India’s pharmaceutical industry is entering a golden era, with projections of becoming a $1 trillion global leader by 2047. This growth not only cements India’s role as the pharmacy of the world but also creates vast opportunities for investment, innovation, and employment. By addressing both global and domestic healthcare needs, the sector is set to play a pivotal role in India’s economic and social development in the coming decades. Policymakers and investors must seize this moment to strengthen India’s infrastructure, innovation, and global partnerships, ensuring that the nation sustains its leadership in the pharmaceutical landscape.
On November 12, 2024, engineering giant Larsen & Toubro (L&T) has announced a major contract from NTPC for developing thermal power plants in Madhya Pradesh and Bihar. Although L&T has not disclosed the precise value of this ‘limited notice to proceed’ (LNTP) order, estimates from analysts suggest a value close to ₹22,000 crore, ranking among the company’s largest domestic projects, similar to its 2020 bullet-train contract for the Mumbai-Ahmedabad High-Speed Rail Project.
Order Details and Strategic Shift
The project includes a 2×800 MW thermal power plant at Gadarwara in Madhya Pradesh and a 3×800 MW plant at Nabinagar in Bihar. This order is particularly noteworthy as it signals a change in L&T’s strategy; the company had previously decided against bidding for thermal power projects due to unfavourable contract terms. However, recent discussions led to a strategic reversal, as explained by Subramanian Sarma, President (Energy) and Whole-Time Director of L&T, during an October media call.
Background and Historical Wins
This order win adds to L&T’s substantial order book, which stood at ₹5.1 trillion as of September 2024, with 40% of projects based internationally, especially in West Asia. L&T’s recent win rivals the scale of its 2020 contract to construct a 237.1-km section of the Mumbai-Ahmedabad high-speed rail (MAHSR) project, previously its largest engineering, procurement, and construction (EPC) contract in India.
Market Performance
On the day of the announcement, L&T’s stock closed at ₹3,547.95 on the BSE, a decrease of 1.21%. The stock price has fluctuated within a 52-week range of ₹3,031.05 to ₹3,948.60, reflecting investor responses to the company’s high-value order book and strategic shifts.
Ashok Leyland Ltd. (NSE: ASHOKLEYNSE) is a leading player in India’s commercial vehicle and defense sectors. As of the latest market close, its stock is priced at ₹222.42, reflecting a decrease of ₹2.97 (-1.32%). With a market capitalization of ₹661.72 billion and a P/E ratio of 27.05, the company faces an evolving market environment. Ashok Leyland’s innovation focus and advancements in alternative fuel vehicles offer promising future prospects. This report provides a detailed analysis of the company’s financials, strategic growth plans, and the latest developments in green mobility.
Latest Developments
Hydrogen-Powered Truck Launch and Electric Truck Deliveries
Hydrogen-Powered Truck: On October 2, 2024, Ashok Leyland announced its plans to commercially launch India’s first hydrogen-powered truck within the next 18-24 months. This follows the unveiling of India’s first hydrogen internal combustion engine (H2-ICE) powered heavy-duty truck, in collaboration with Reliance Industries, in February 2023. The company is positioning itself as a leader in green transportation, with hydrogen-powered vehicles representing a significant step towards sustainable energy solutions.
Electric Truck Deliveries: On the same day, Ashok Leyland commenced delivery of 180 electric trucks to Billion Electric Mobility, marking the largest single order of electric trucks in India to date. The vehicles, including the BOSS Electric Truck and the AVTR 55T Electric Tractor, will be deployed on key routes, such as Chennai-Bengaluru and Chennai-Vijayawada. The company has also announced plans to expand production of electric trucks at its Hosur plant, focusing on alternative energy vehicles.
CEO Shenu Agarwal’s Statement: “Ashok Leyland is committed to pushing the boundaries of innovation, leading the shift to green mobility. Our BOSS ICV Electric trucks and AVTR 55T Electric Tractors represent cutting-edge technology aimed at enhancing the customer experience and promoting sustainability,” Agarwal said.
These strategic initiatives reflect Ashok Leyland’s commitment to offering eco-friendly mobility solutions and revolutionizing India’s commercial vehicle industry through green technology.
Company Overview
Founded: September 7, 1948 Headquarters: Chennai, India CEO: Shenu Agarwal Employees: Approximately 31,770 (FY) Website:ashokleyland.com
Ashok Leyland Ltd. is a dominant player in the manufacturing and sale of commercial and defense vehicles. With its recent advancements in hydrogen and electric vehicle technologies, the company is positioning itself for long-term growth in sustainable mobility.
Stock Performance
Current Price: ₹222.42
Day’s Change: -₹2.97 (-1.32%)
Market Capitalization: ₹661.72 billion
Dividend Yield: 0.00%
P/E Ratio (TTM): 27.05
Basic EPS (TTM): ₹8.34
The stock has experienced a slight decline in recent trading sessions. Investors should monitor the P/E ratio relative to industry peers to assess valuation attractiveness.
Fundamental Analysis
Key Metrics
Market Capitalization: ₹661.72 billion
Enterprise Value: ₹661.72 billion
Price-to-Sales (P/S) Ratio: 1.41x
Net Income: Data pending
Revenue: Data pending
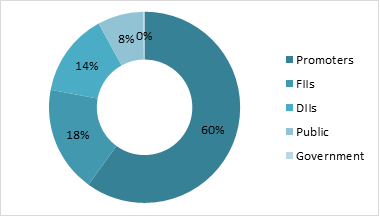
Ownership Structure
Free Float Shares: 1.76 billion (59.89%)
Closely Held Shares: 1.18 billion (40.11%)
Ashok Leyland’s ownership structure shows a strong free float, enhancing liquidity for investors, though the significant portion of closely held shares could influence stock volatility based on insider activity.
Valuation
Ashok Leyland’s P/E ratio of 27.05x suggests that investors are paying ₹27.05 for every ₹1 of earnings, which is relatively high compared to industry standards. The P/S ratio of 1.41x aligns with a fair valuation relative to its revenue.
Historical Valuation Trends
2019-2023 P/E Ratio: An upward trend in valuation reflects increased investor confidence and earnings growth.
P/S Ratio: Steady growth, indicative of expanding revenue.
Financial Health
Debt and Coverage
Debt Level (2023): ₹450 billion
Free Cash Flow: Data pending
Cash & Equivalents: Data pending
Ashok Leyland maintains significant debt, which will require close attention as the company expands into hydrogen and electric vehicle production. Managing cash flows and debt servicing capabilities will be key to ensuring long-term financial health.
Asset and Liability Structure
Total Assets (2023): ₹400 billion
Total Liabilities (2023): ₹450 billion
Liabilities exceeding assets raise potential solvency concerns, and investors should monitor the company’s strategies for reducing debt.
Growth Prospects
Green Mobility Initiatives
Hydrogen-Powered Trucks: The expected launch of the first hydrogen-powered truck in 18-24 months marks a significant development for the company and India’s shift towards sustainable transportation.
Electric Truck Production: With new electric vehicle models being delivered, and specialized assembly lines planned for the Hosur plant, Ashok Leyland is poised for growth in the electric commercial vehicle segment.
Adani Ports & Special Economic Zone Ltd. (ADANIPORTS), founded in 1998 and headquartered in Ahmedabad, India, is a leading company in the transportation and logistics sector. It specializes in developing, operating, and maintaining port-related infrastructure through two key segments: Port and Special Economic Zone (SEZ) activities, and Others (which includes services like aircraft operations and container train services). ADANIPORTS is India’s largest private port operator, with a growing presence in international trade and infrastructure projects.
Market Outlook for ADANIPORTS:
Adani Ports & SEZ Ltd. has shown strong long-term growth, with a 63.28% increase over the past year and a 32.02% rise YTD. However, short-term volatility is evident, as the stock dropped 4.14% in one day, reflecting broader market trends or specific company developments. With upcoming earnings on October 29, 2024, market participants will closely monitor results to gauge the company’s recovery from recent dips. Long-term growth prospects remain solid, driven by infrastructure investments and international expansion.
Business Segments:
Adani Ports & Special Economic Zone Ltd. operates through two primary business segments:
Port and SEZ Activities: This includes the development, operation, and maintenance of ports and port-related infrastructure. It is the core segment responsible for handling the majority of India’s cargo movement and facilitating international trade.
Others: This segment consists of ancillary activities such as aircraft operations, utilities services, and container train services. Both segments contribute to the company’s strong infrastructure and logistics footprint in India and internationally.
Q1 FY25 Highlights:
For Q1 FY25, Adani Ports & Special Economic Zone Ltd (APSEZ) delivered strong financial performance. Here are the key highlights:
Revenue Growth: Revenue grew by 11.34% year-on-year (YoY) to ₹6,956 crore. This growth was fueled by an 8% YoY increase in cargo volumes, reaching 109 million metric tons (MMT). Container volumes rose by 18%, and liquids and gas volumes increased by 11%.
Net Profit: The company reported a net profit of ₹3,113 crore, marking a 47% increase YoY. This sharp rise was despite a temporary disruption at Gangavaram Port, which caused a 5.7 MMT cargo volume loss. However, operations there have now been restored.
EBITDA: APSEZ recorded a quarterly EBITDA of ₹4,245 crore, a 13.1% YoY growth, with the EBITDA margin increasing to 61%. Domestic port EBITDA also saw a 32 basis point improvement.
Outlook for FY25: The company expects to generate revenue between ₹29,000 crore to ₹31,000 crore, and EBITDA of ₹17,000 crore to ₹18,000 crore. Cargo volumes are expected to be between 460 MMT and 480 MMT. Additionally, capital expenditures for the year are projected to be around ₹10,500 crore to ₹11,500 crore.
Financial Summary:
Financial Metric
Amount
Revenue (Q1 FY25)
₹6,956 crore
Net Profit (Q1 FY25)
₹3,113 crore
EBITDA (Q1 FY25)
₹4,245 crore
Revenue Growth (YoY)
11.34%
Net Profit Growth (YoY)
47%
EBITDA Margin (Q1 FY25)
61%
Cargo Volume (Q1 FY25)
109 MMT
Estimated Revenue (FY25)
₹29,000 – ₹31,000 crore
Estimated EBITDA (FY25)
₹17,000 – ₹18,000 crore
Capital Expenditure (FY25)
₹10,500 – ₹11,500 crore
Note: Adani Ports’ strong Q1 performance reflects its resilience and strategic initiatives in navigating operational challenges while capitalizing on growth opportunities. The company’s robust financial metrics position it well for future growth, making it a key player in the Indian logistics and transportation landscape.
Recent News:
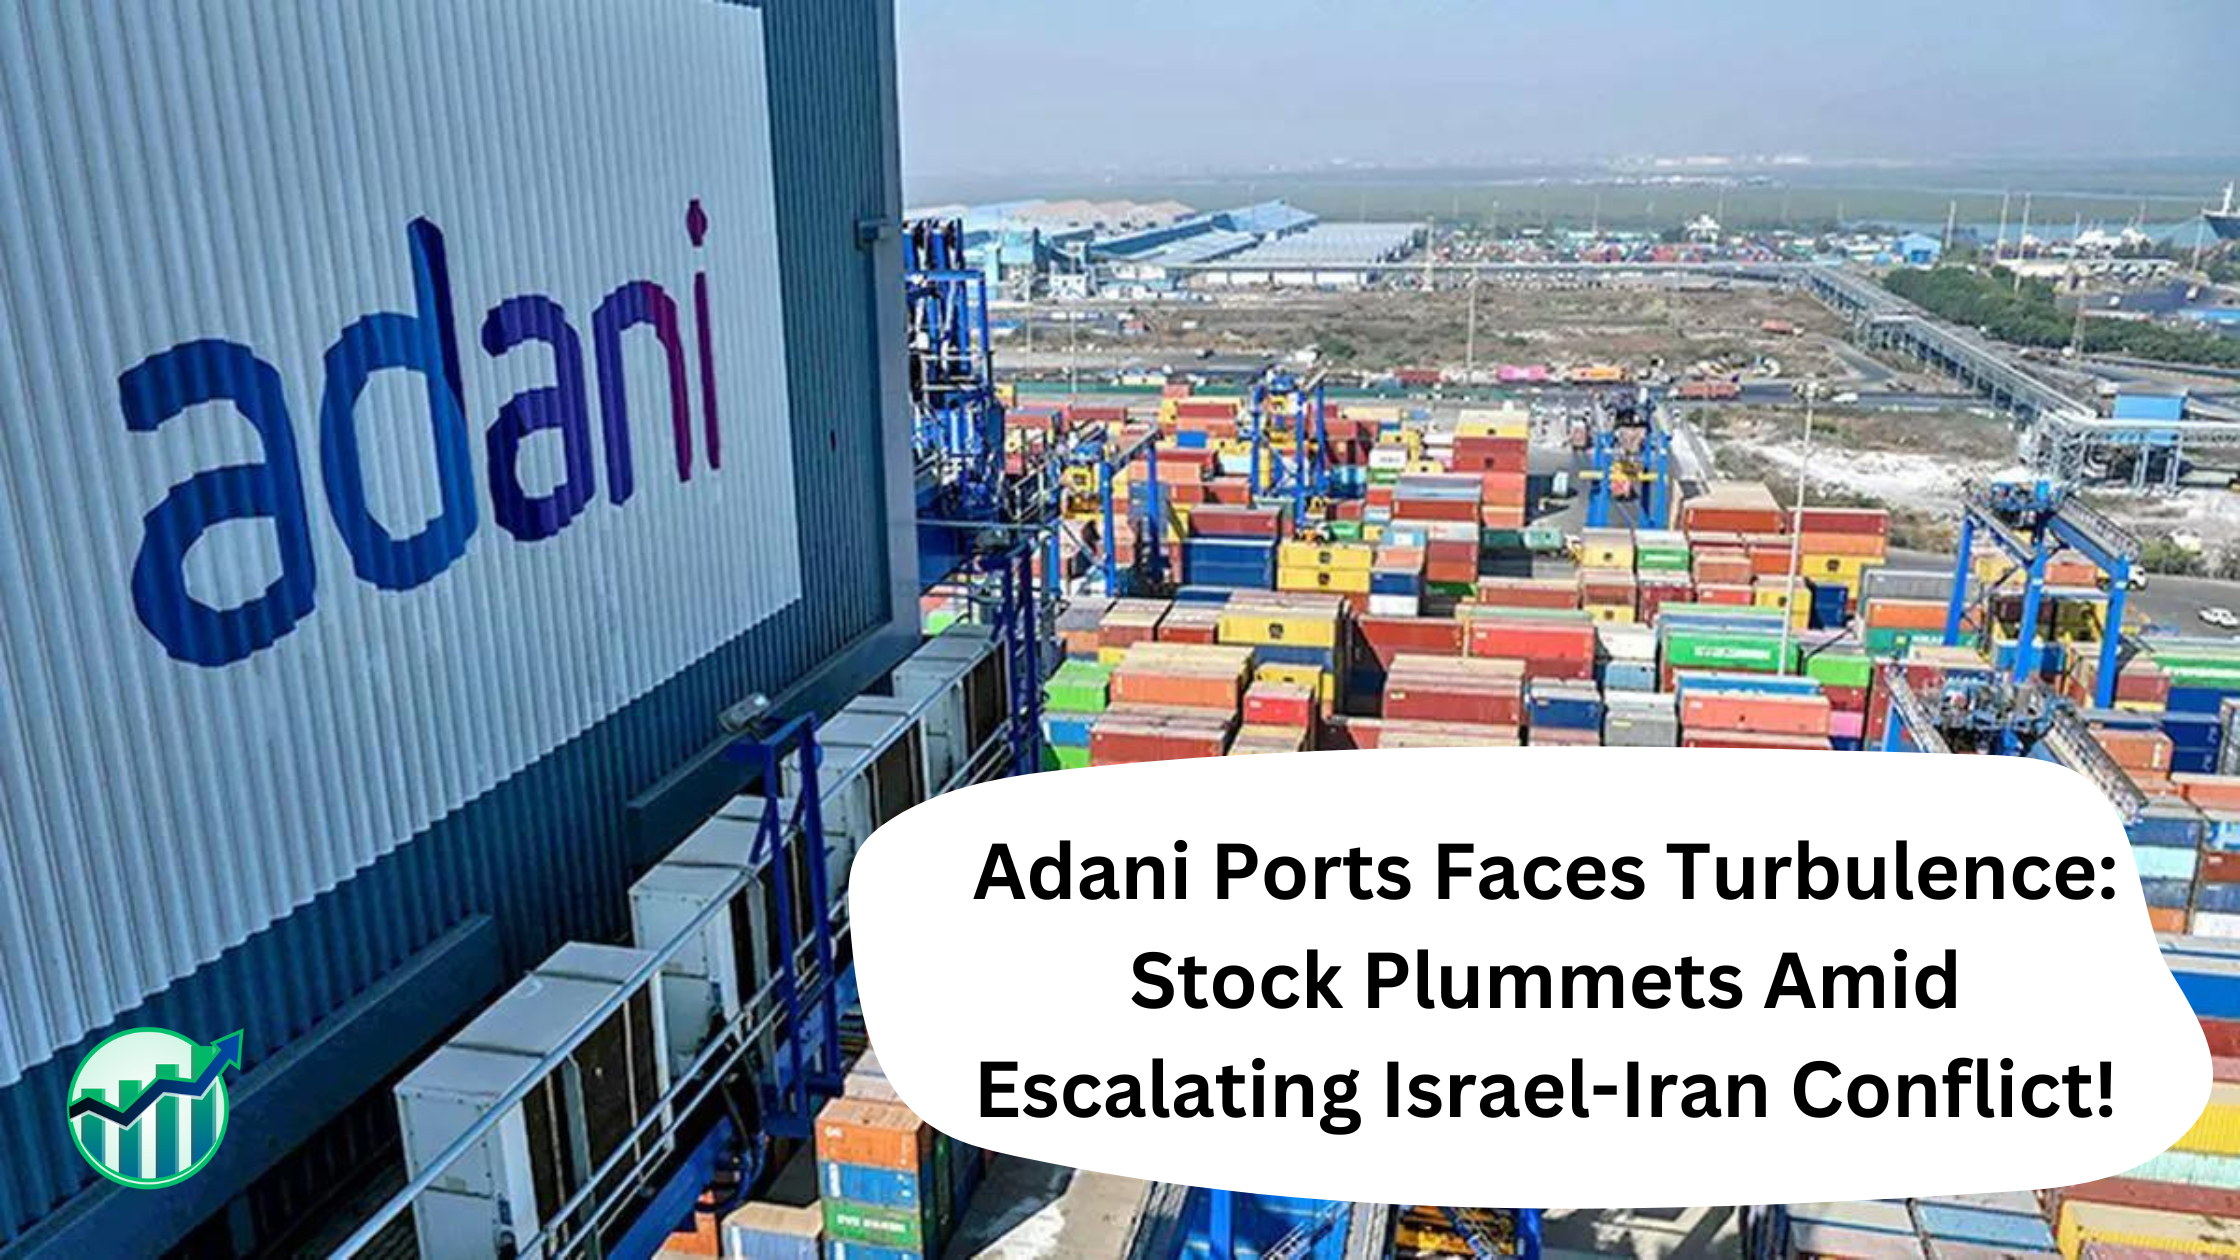
Adani Ports shares slipped 5.4% to an intra-day low of ₹1,337 as Hamas fired rockets in southern Israel, making it the major loser in the Nifty 50 on October 7. The company operates Haifa Port, located in the south of Israel, and the Israeli military reported that rockets fired from northern Gaza entered southern Israel on October 6, a day before the first anniversary of Hamas’s October 7 attack.
A year ago, when the conflict between Hamas and Israel erupted, Adani Ports issued a statement saying, “We are closely monitoring the action on the ground which is concentrated in south Israel, whereas Haifa Port is situated in the north. We have taken measures to ensure the safety of our employees, and all of them are safe. We remain fully alert and prepared with a business continuity plan that will enable us to respond effectively to any eventuality.”
Adani Ports’ stock has again fallen after Hamas fired rockets over Israel on October 6, resulting in some humanitarian loss for Israel. The Adani Group fully acquired Haifa Port in February 2023, with Israel’s envoy to India emphasizing the symbolic trust placed in Indian companies by handing over a strategic asset.
Adani Ports vs. Nifty 50:
The stock of Adani Ports has fallen 6% in the past five trading sessions and 5.5% in the last month. However, it has provided a 30% return year-to-date, 72% over the past year, and 232% over the last five years. In comparison, the Nifty 50 index has fallen 5% in the past five days and erased 0.6% of investors’ wealth in the last month but has risen 14% year-to-date and provided a 27% return over the past year.
Jio Financial Services (JioFin), the brainchild of Reliance Industries, has been making waves in the Indian financial sector. Launched in July 2023, the company boasts a diverse portfolio encompassing finance, trading, investment services, and a robust digital payments infrastructure.
Current Market Snapshot:
Stock Price: ₹ 338.80 (as of October 4, 2024)
Market Cap: ₹ 2.20 Trillion
P/E Ratio (TTM): 138.51 (considered high)
While financial data is limited due to its recent spin-off, JioFin’s high P/E ratio suggests the market is bullish on its future potential. However, it’s important to acknowledge that the company might be currently loss-making as it invests in building its customer base.
Market Outlook: JioFin possesses several factors that position it for future growth:
Strong Backing: Reliance Industries’ legacy and vast customer base provide a solid foundation for JioFin’s expansion.
Diversified Services: The company offers a comprehensive suite of financial services, catering to a wide range of customer needs.
Digital Focus: With a robust digital infrastructure, JioFin is well-positioned to leverage India’s growing digital financial landscape.
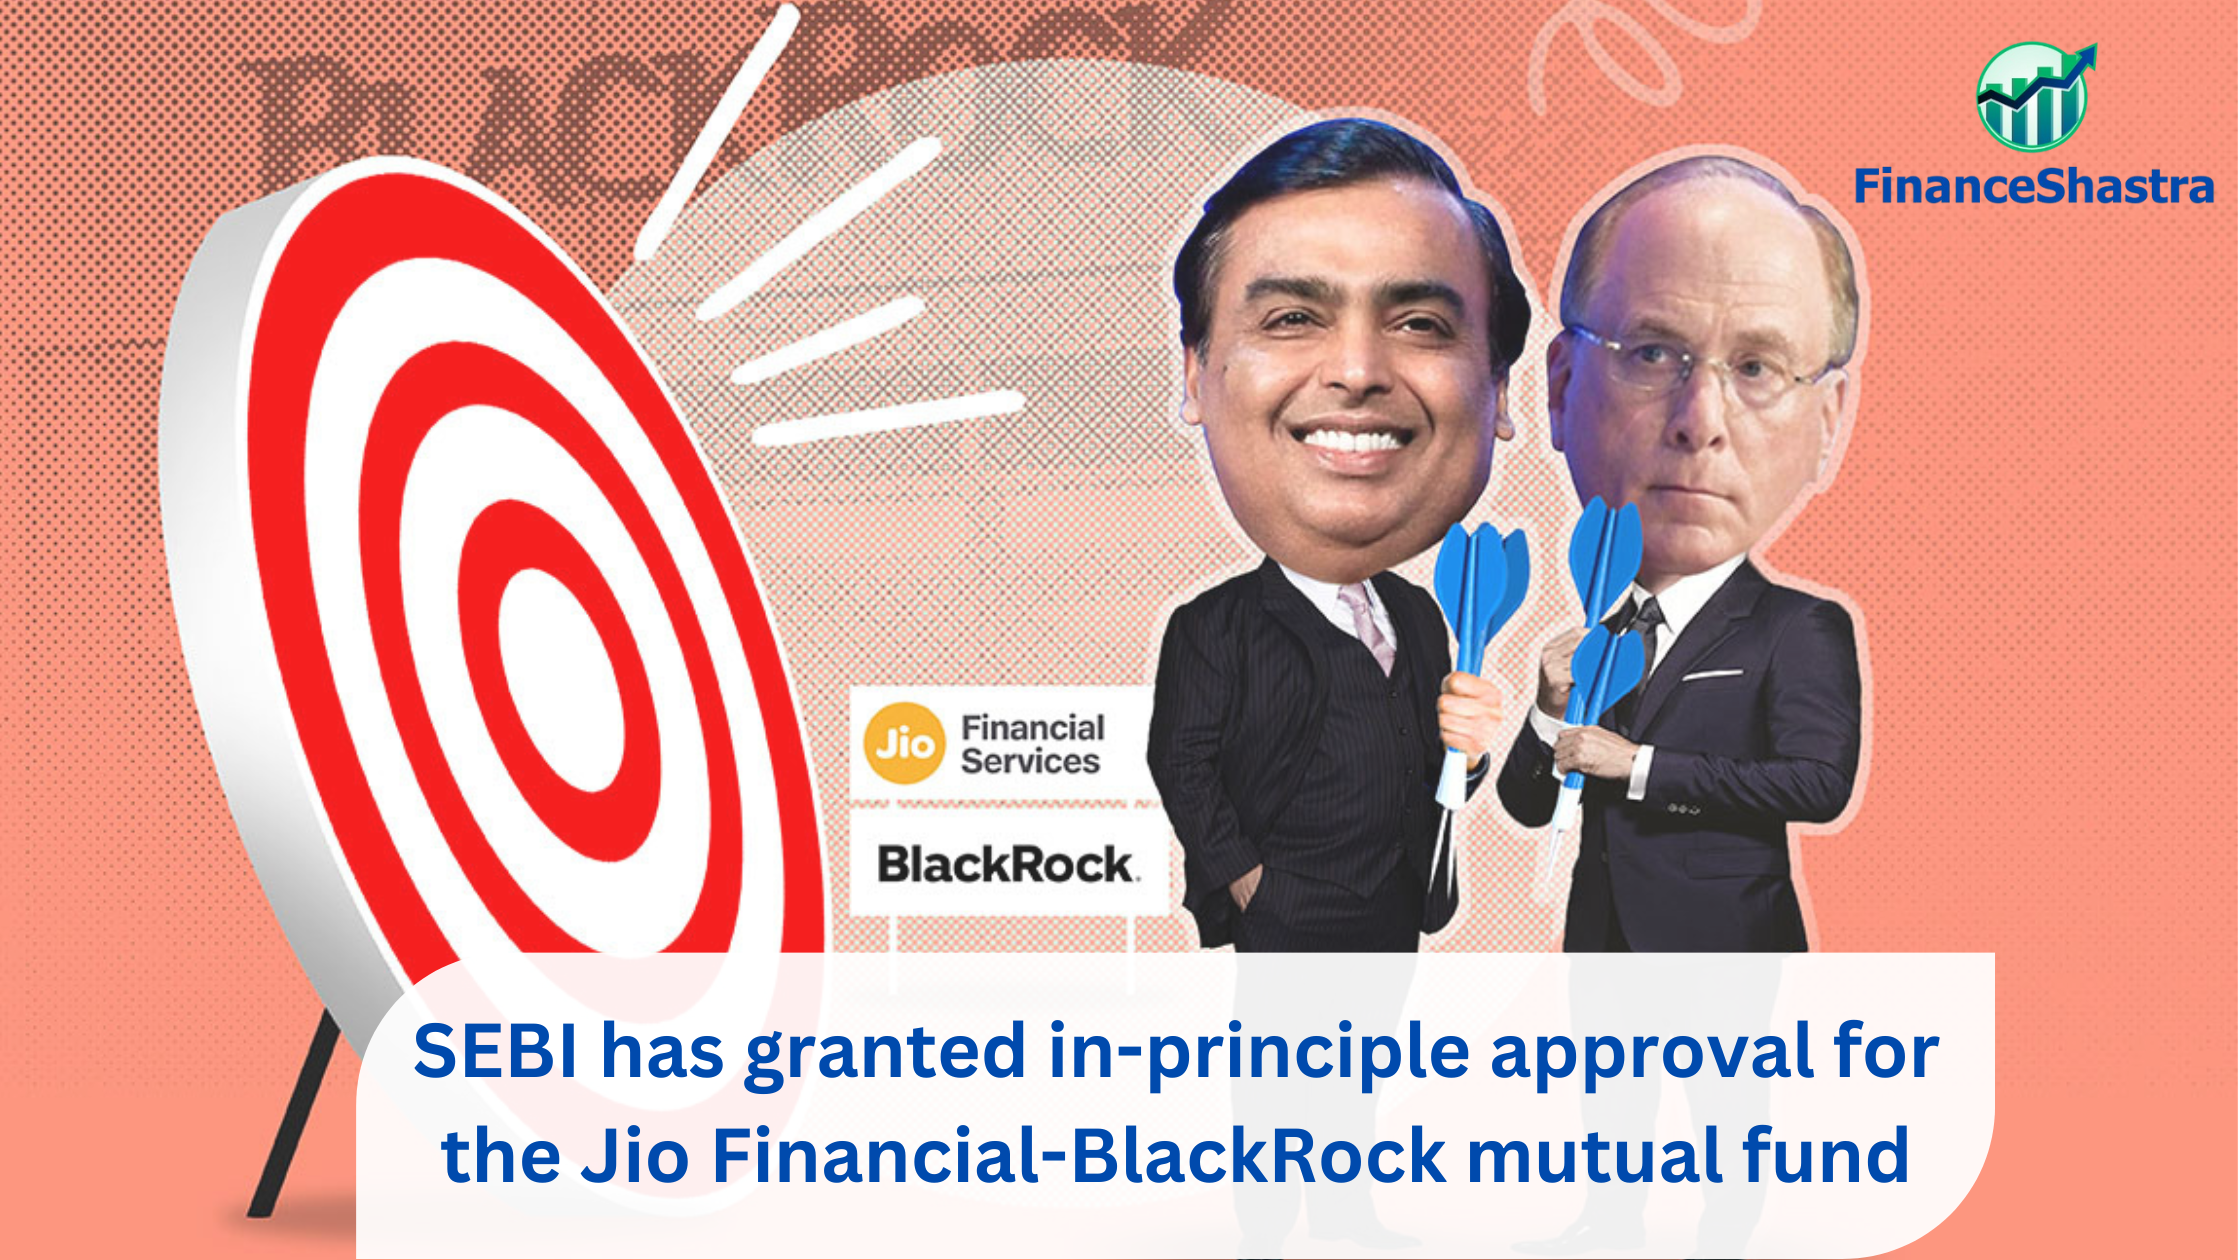
BlackRock Partnership: A Game Changer? JioFin’s recent partnership with global investment giant BlackRock could be a major game changer. The joint venture, Jio BlackRock, will combine BlackRock’s investment expertise with JioFin’s local knowledge and digital reach. This partnership holds immense potential to:
Introduce New Investment Products: Jio BlackRock is expected to offer a broader range of investment products to Indian investors.
Enhanced Expertise: BlackRock’s experience in investment management, risk management, and technology will undoubtedly benefit JioFin.
Increased Scale and Scope: The combined strengths of both companies could create a major player in the Indian financial market.
Navigating Uncertainty: Despite its promising future, JioFin faces some challenges:
Limited Financial Data: Lack of historical financial data makes it difficult to comprehensively analyze the company’s performance.
Competitive Landscape: The Indian financial sector is fiercely competitive, and JioFin needs to carve out its niche.
Profitability Concerns: As a young company, JioFin may take time to achieve profitability.
Investing in JioFin: A Calculated Risk?
JioFin’s high growth potential is undeniable, but the lack of financial data and potential for short-term losses introduce an element of risk. Investors should conduct thorough research, understand their risk tolerance, and consider these factors before making any investment decisions.
About Vodafone idea Vodafone Idea Ltd. (VIL), formed from the merger of Vodafone India and Idea Cellular, is a key player in India’s telecom sector. Despite offering extensive voice and data services across 2G, 3G, and 4G platforms, the company faces substantial financial challenges including a heavy debt burden and stiff competition. VIL is committed to network modernization and has initiated strategic partnerships to boost its 5G capabilities. However, the financial constraints continue to weigh heavily on its profitability and market standing.
Company Overview
Founded: 1995 (merger in 2018)
Headquarters: Mumbai, India
CEO: Akshaya Moondra
Employees: 16,080
Industry: Wireless Telecommunications
VIL offers prepaid, postpaid, voice, and data services. It is actively pursuing opportunities in enterprise solutions, digital services, and 5G infrastructure to diversify its revenue streams and improve its market position.
Key Financial Metrics
Market Capitalization: ₹709.54 billion INR
Revenue (FY 2023): ₹425.77 billion INR
Net Income (FY 2023): -₹312.38 billion INR
Basic EPS (TTM): -₹5.83 INR
Debt: ₹2.5 trillion INR
Beta (1Y): 1.34
Current Price: ₹9.87 INR (YTD Decline: -39.07%)
52-Week Range: ₹4.25 – ₹12.20 INR
VIL’s financial health remains a concern, with continued losses and an extremely high debt burden, which limits its operational flexibility and ability to invest in growth. The negative earnings per share (EPS) indicate that traditional valuation metrics, such as the price-to-earnings (P/E) ratio, are not applicable for VIL.
Market Challenges VIL operates in an increasingly competitive telecom market dominated by strong players such as Reliance Jio and Bharti Airtel. The company has struggled to maintain profitability, compounded by the regulatory burdens and the financial strain of legacy AGR (Adjusted Gross Revenue) dues.
Key Challenges:
High Debt: VIL’s debt exceeds ₹2.5 trillion INR, putting significant pressure on cash flow and limiting its ability to invest in network expansion.
Losses: The company has reported large negative earnings for several years, impacted by high finance costs and operating expenses.
Competition: With Reliance Jio and Bharti Airtel dominating the market, VIL’s market share has been eroding, making it difficult to sustain revenue growth. Opportunities Despite these challenges, Vodafone Idea is pursuing strategies to stabilize and potentially improve its market position. These include:
ARPU Growth: VIL can increase its Average Revenue Per User (ARPU) through premium services, improved customer experiences, and strategic pricing.
5G Rollout: The company’s recent strategic partnerships, including those aimed at accelerating its 5G infrastructure development, are expected to drive network modernization and enhance service offerings.
Enterprise Solutions and Cloud Services: Vodafone Idea is actively seeking to diversify its revenue streams by expanding into enterprise digital solutions and cloud services.
Recent Performance & Projections In the latest quarter (Q2 2024), Vodafone Idea reported revenue of ₹105.08 billion INR, slightly below market expectations. The EPS for the quarter was -0.95 INR, better than analysts’ estimate of -1.61 INR, reflecting a modest improvement. However, these figures underscore the continued struggle with profitability.
Next Quarter Estimates:
Revenue: ₹113.41 billion INR
EPS: -0.92 INR
While the revenue outlook shows some promise of growth, ongoing negative EPS signals that the company remains far from achieving profitability.
Investment Considerations Given VIL’s significant financial challenges, the stock is viewed as speculative. Investors should be cautious, particularly given the company’s:
Negative Net Income: Persistent losses over several years make VIL a risky investment, particularly for those seeking returns from dividends or capital gains.
Debt: The company’s massive debt load creates significant financial risk, making any turnaround uncertain.
Market Competition: VIL’s position in the telecom market continues to be threatened by better-capitalized competitors, posing long-term sustainability challenges. Analyst Consensus The outlook from analysts is mixed. While some recommend a buy for short-term gains, others advocate caution or a hold due to the company’s financial instability and high risk. Recovery will largely depend on successful execution of its 5G strategy, debt management, and capturing higher ARPU.
Conclusion: A High-Risk, Speculative Bet Vodafone Idea’s current financial condition, characterized by high debt, persistent losses, and stiff competition, makes it risky for investors. While there is potential for short-term gains, particularly as the company focuses on ARPU growth and 5G partnerships, long-term investors should be prepared for volatility and the uncertainty of VIL’s turnaround efforts.
In its latest market note, Kotak Institutional Equities emphasizes the importance of caution in the current market, as inflated valuations across the board — including PSUs and stocks like VIL — pose significant risks. Investors are advised to carefully weigh potential rewards against risks in such stocks, where financial instability could lead to unfavorable outcomes during market corrections.