

Sundaram Finance Expands in Tier-3 Tamil Nadu: Emerging Business Opportunities
Sundaram Finance Ltd: Overview
Sundaram Finance Ltd was established in 1954, with the business of financing the purchase of commercial vehicles and now it has diversified into many other segments like home finance, Mutual funds, general insurance, financial service distribution, etc. It has subsidiaries for different work segments like India Equipment Leasing Ltd, Sundaram Home Finance Ltd. It had a total of 680+ branches and as a group they had 1050+ branches worldwide. They have 671 branches for Asset Finance, 117 for Home Finance, 164 for General Insurance and 85 for Mutual Funds. They also have diesel finance and tyre finance to pay in 3-6 instalments. The total group AUM stood at 108,000 crore and 34,500 crore is under asset finance and 54,800 under AMC business. Sundaram Finance Ltd has risen term funding of ₹8000 crore from Banks, Mutual funds and Insurance companies.
Stock News
Sundaram Home Finance Ltd has announced plans to expand its presence in tier-3 towns in western Tamil Nadu under its ‘Emerging Business’ segment, citing strong growth potential. Currently it handles overs 15 branches in that region and aims to disburse ₹500 crore in next 12-18 months, with ₹50 crore targeted to specifically with EB. This move follows the successful launch of its Coimbatore branch. The Pollachi branch will offer small business loans of up to Rs 20 lakh to entrepreneurs for working capital and business growth. It will also target the affordable housing finance market, offering loans of up to Rs 35 lakh.
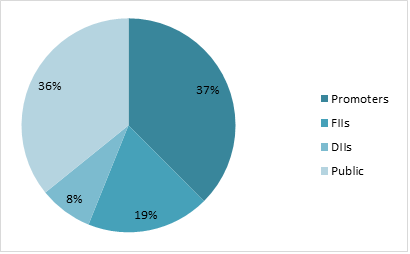
Shareholding Pattern as on September 2024
Key Stats
| Market Cap | ₹51726 Crore |
| Revenue | ₹8013 Crore |
| Profit | ₹1603 Crore |
| ROCE | 9.21 % |
| P/E | 32.26 |
Peer Comparison
| Amt in ₹ Cr | MCap | Sales | PAT | ROCE | Asset Turn. | EV/EBITDA | D/E | P/E |
| Sundaram Fin. | 51718 | 8013 | 1603 | 9.21% | 0.12 | 16.85 | 4.5 | 32.27 |
| Shriram Fin. | 114517 | 38466 | 7839 | 11.3% | 0.16 | 11.08 | 3.97 | 14.57 |
| Muthoot Fin. | 89907 | 14397 | 4413 | 13.2% | 0.16 | 13.64 | 2.82 | 20.34 |
| L&T Fin. | 35468 | 15009 | 2573 | 8.22% | 0.13 | 12.58 | 3.5 | 13.8 |
| Chola Fin. | 29156 | 29603 | 2054 | 10.73% | 0.17 | 10.33 | 13.85 | 14.24 |
Financial Trends
| Amount in ₹ Cr | FY2020 | FY2021 | FY2022 | FY2023 | FY2024 |
| Revenue | 4707 | 5292 | 5111 | 5501 | 7274 |
| Expenses | 3649 | 3894 | 3628 | 3695 | 5050 |
| EBITDA | 1058 | 1398 | 1483 | 1806 | 2224 |
| Financing Margin % | 22% | 26% | 29% | 33% | 31% |
| Net Profit | 845 | 1223 | 1296 | 1510 | 1842 |
| NPM | 18.0% | 23.1% | 25.4% | 27.4% | 25.3% |
| EPS | 71.25 | 104.7 | 105.6 | 119.5 | 129.3 |
Stock Price Analysis
Sundaram Finance Ltd.’s share price is experiencing a bullish surge today, rising by approximately 8.5%. As of January 2, 2025, the stock opened at ₹4,125.65 and reached a high of ₹4,418.80 during intraday trading. This increase comes on the heels of a challenging week, where the stock had previously dropped by 7.08%. The current trading volume stands at 354,146 shares, reflecting robust investor interest. From a technical standpoint, Sundaram Finance’s stock is currently navigating through significant resistance levels. The 52-week low is recorded at ₹3,447.00, while the 52-week high stands at ₹5,535.85.