
State Bank of India Ltd: Leading the Way in Banking Innovation and Growth
Company Overview
State Bank of India: A Leading Multinational Banking Institution
Established on July 1, 1955, following the nationalization of the Imperial Bank of India, the State Bank of India (SBI) is India’s largest multinational public sector bank, headquartered in Mumbai. Formed with the Reserve Bank of India initially acquiring a 60% stake, SBI has grown into a cornerstone of the Indian financial system.
SBI offers a comprehensive range of financial solutions through four primary segments: Treasury, Corporate/Wholesale Banking, Retail Banking, and Other Banking Business. Its extensive network, consisting of over 22,000 branches across India and 227 international offices in 30 countries, supports global financial operations from hubs like New York, Tokyo, and London. As a leader in digital innovation, SBI has introduced initiatives like SBI e-tax for online tax payments and the Virtual Debit Card, enhancing customer security and convenience.
The bank has experienced significant growth and expansion through strategic acquisitions, notably the 2017 merger with five associate banks and the Bharatiya Mahila Bank, which solidified its domestic dominance. Internationally, SBI has forged global collaborations, including a Payments Bank partnership with Reliance Industries and ventures with Visa and Elavon for merchant acquiring services. Its subsidiaries, such as SBI Life Insurance, a joint venture with Cardif S.A., and SBI Funds, recognized as ‘Mutual Fund of the Year,’ underscore its excellence in insurance and asset management.
SBI actively supports national development initiatives through specialized products like the Defence Salary Package and senior citizen loans. By leveraging technology-driven services, it ensures seamless financial solutions for customers across both urban and rural areas. With its strong domestic foundation and growing international presence, SBI continues to cement its role as a leader in the global banking sector.
Returns Summary
| YTD | 1 Month | 6 Month | 1 Year | 2 Year | 3 Year | 5 Year |
| 33.02% | 4.01% | -5.72% | 49.33% | 40.56% | 80.46% | 154.00% |
Result Highlights
- State Bank of India (SBI) demonstrated a strong performance in Q2FY25, showcasing growth in profitability, business expansion, asset quality, and digital transformation. The bank reported a Net Profit of ₹18,331 crores, reflecting robust earnings. Key profitability metrics like Return on Assets (ROA) at 1.13% and Return on Equity (ROE) at 21.78% for H1FY25 underscore efficient capital utilization, while the Net Interest Margin (NIM) of 3.18% (3.31% domestic) highlights sustainable profitability.
- SBI’s business growth remained impressive, with deposits crossing ₹51 trillion, up 9.13% YoY, and advances exceeding ₹39 trillion, registering a 14.93% YoY growth. This reflects balanced expansion across deposits and credit segments, positioning SBI for competitive market share growth. Asset quality improved significantly, with Gross NPA at 2.13% and Net NPA at 0.53%, supported by a Provision Coverage Ratio (PCR) of 75.66%, rising to 92.21% when including AUCA. Additionally, the bank maintained conservative provisioning, setting aside ₹31,084 crores, equivalent to 153% of Net NPAs, ensuring resilience against potential losses.
- SBI’s digital transformation continues to lead, with >98% of transactions via alternate channels and over 8.13 crore users on its YONO app. Notably, 61% of savings accounts were opened digitally in Q2FY25, highlighting the platform’s pivotal role in customer acquisition and engagement. The bank’s liability franchise benefits from its 22% market share in deposits, with 10.05% YoY growth in current account balances, and a credit-to-deposit ratio of 67.87%, reflecting healthy lending activity.
- To support future growth, the Central Board approved raising up to ₹20,000 crores in long-term bonds in FY25. This capital infusion, through public or private placement, will enhance the bank’s capital base, supporting its strategic goals of credit expansion and financial stability, while sustaining a balanced credit-to-deposit ratio. These initiatives position SBI for stable, long-term growth in a competitive banking landscape.
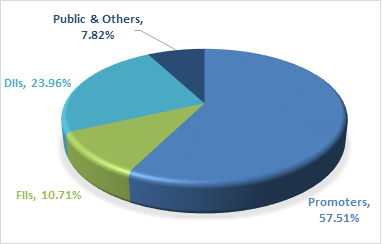
Shareholding Pattern
Return Comparison with Peers
| Company | ROCE | 6 Months | 1 Year | 3 Year | 5 Years |
| State Bank of India | 6.16% | 4.53% | 43.59% | 21.75% | 20.49% |
| Bank of Baroda | 6.33% | -5.34% | 21.77% | 42.16% | 20.01% |
| Punjab National Bank | 5.46% | -12.86% | 28.92% | 41.02% | 11.63% |
| IOB | 5.41% | -18.30% | 32.48% | 37.16% | 39.38% |
| Union Bank of India | 6.55% | -12.79% | 10.39% | 39.99% | 16.74% |
| Canara Bank | 6.63% | -10.92% | 23.11% | 36.54% | 19.29% |
| Indian Bank | 5.92% | 6.88% | 41.61% | 59.60% | 36.32% |
SBI Outlook and Contribution to Industry
State Bank of India (SBI) stands as a cornerstone of the Indian banking sector, with a ₹52 lakh crore balance sheet and a 22% market share in deposits. It dominates segments like home loans (26.5%) and auto loans (19.8%), supported by its 22,000 domestic branches and operations in 30 countries. SBI’s YONO digital platform drives innovation, handling 66 crore transactions annually, reflecting its leadership in technology-driven banking.
The industry outlook for FY25 and beyond is positive, with GDP growth at 6.7% in Q1 FY25, stable global conditions, and robust banking sector projections of 11-12% deposit growth and 12-13% credit growth. SBI leads this momentum, achieving ₹51.17 trillion in deposits and 14.93% credit growth YoY, backed by a strong capital adequacy ratio of 13.76% and high asset quality (Gross NPA at 2.13%).
Digital transformation remains a key driver, with over 8 crore digital users and 61% of savings accounts opened digitally in Q2 FY25. Its subsidiaries, such as SBI Life Insurance and SBI Funds, diversify its revenue streams, bolstering financial stability.
SBI’s focus on sustainable growth, digital innovation, and robust asset management positions it to capitalize on India’s economic momentum, ensuring long-term leadership and enhanced shareholder value.
Balance Sheet Analysis
SBI’s balance sheet from FY20 to FY24 shows steady expansion in key financial areas. Deposits grew from ₹32,74,160.63 crores to ₹49,66,537.49 crores, reflecting the bank’s strong customer base and competitive edge in attracting funds. Simultaneously, advances saw a significant rise, from ₹23,74,311.18 crores to ₹37,84,272.67 crores, driven by robust growth across corporate, retail, and MSME sectors. The bank has also shown consistent growth in reserves, increasing from ₹2,50,167.66 crores to ₹4,14,046.71 crores, indicating a strong capital base to support long-term sustainability. Borrowings grew from ₹3,32,900.67 crores to ₹6,39,609.50 crores, signifying
SBI’s use of external funding to drive its growth. While this increase reflects SBI’s expansion, effective asset-liability management remains critical. Investments and other assets also rose significantly, supporting SBI’s diversified portfolio. The net block remained stable, reflecting a balanced approach to capital expenditure in fixed assets. With strong asset growth and prudent liability management, SBI is well-positioned for continued market leadership in India’s banking sector, strengthened by its digital transformation through platforms like YONO.
Cash Flow Analysis
SBI’s cash flow analysis from FY2013 to FY2024 reveals significant fluctuations in its operational, investing, and financing activities. Operating cash flows have been largely positive, with notable spikes in FY2017 (+₹77,406 crores) and FY2022 (+₹89,919 crores), reflecting strong operational efficiency. However, negative flows in FY2018 and FY2023 highlight challenges such as higher provisioning for bad loans. In terms of investing activities, cash flows have consistently been negative, with the bank investing heavily in growth, technology, and acquisitions. A rare positive period in FY2018 likely reflects asset disposals. Financing activities show volatility, with positive cash inflows in certain years due to capital raising and negative flows in others, such as FY2024, likely reflecting debt repayments and a focus on capital strengthening. Despite these fluctuations, SBI has managed to maintain positive net cash flow in key years, ensuring liquidity for growth. Overall, SBI’s cash flow patterns reflect strategic financial management, including debt reduction and investment in expansion, positioning it for long-term growth.