ITC Limited: Comprehensive Overview and Strategic Stake Acquisitions in EIH-HLV
ITC Limited: Overview
ITC is the largest cigarette manufacturer and seller in the country. Established in 1910, it operates in five business segments- Cigarettes, Hotels, FMCG, Paper& Packaging and Agriculture business. ITC has 80% market share in cigarette industry and is market leader in other segments also. The contribution of export revenue is 23% of the total ITC revenue. The revenue split is Cigarette 37%, FMCG 24%, Hotels 4%, and Paper & Packaging 10%, Agriculture 22%. The hotel business was demerged from ITC Ltd and made new entity ITC Hotels Ltd and ITC Ltd kept its 40% holdings and rest 60% is held by existing shareholders of ITC Ltd.
Latest Stock News (7 Jan 2025)
ITC holds some hotel companies like Fortune Park Hotels Ltd, Bay Island Hotels Ltd, and Landbase India Ltd and WelcomeHotels Pvt Ltd which are wholly owned subsidiary by ITC Ltd. Others are subsidiary, associates and Joint Venture, which all are going to be demerged from ITC Ltd to ITC Hotels Ltd and all shares will be held by ITC Hotels Ltd. In mid-December, ITC acquired stakes in two hotel companies, EIH Ltd and HLV Ltd, and the acquired stakes are 16.13% and 8.11% respectively.
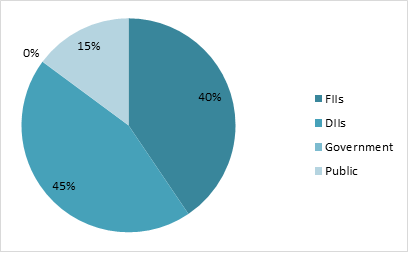
Shareholding Pattern as on September 2024
Key Stats
| Market Cap | ₹565842 Crore |
| Revenue | ₹75135 Crore |
| Profit | ₹20549 Crore |
| ROCE | 37.47% |
| P/E | 27.56 |
Peer Comparison
| Amt in ₹ Cr | MCap | Sales | PAT | ROCE | Asset Turn. | EV/EBITDA | D/E | P/E |
| ITC | 565842 | 75135 | 20549 | 37.47% | 0.8 | 19.03 | 0.00 | 27.56 |
| Godfrey Phillips | 25850 | 4769 | 943 | 22.17% | 0.82 | 22.21 | 0.05 | 27.37 |
| Dabur | 89262 | 12447 | 1759 | 22.28% | 0.86 | 31.39 | 0.17 | 5..78 |
| VST | 5599 | 1419 | 243 | 32.24% | 0.84 | 15.23 | 0.00 | 23.04 |
Financial Trends
| Amount in ₹ Cr | 2020 | 2021 | 2022 | 2023 | 2024 |
| Revenue | 49388 | 49257 | 60645 | 70919 | 70866 |
| Expenses | 30044 | 32193 | 40021 | 45215 | 44634 |
| EBITDA | 19344 | 17065 | 20623 | 25704 | 26233 |
| OPM | 39% | 35% | 34% | 36% | 37% |
| Other Income | 2417 | 2577 | 1910 | 2098 | 2804 |
| Net Profit | 15593 | 13383 | 15503 | 19477 | 20751 |
| NPM | 31.6% | 27.2% | 25.6% | 27.5% | 29.3% |
| EPS | 12.45 | 10.69 | 12.37 | 15.44 | 16.39 |
Stock Price Analysis
In terms of performance, ITC has shown a return of -6.64% in one day, -3.69% over the past month, and -10.62% in the last three months. Over the past 52 weeks, the shares have seen a low of ₹399.3 and a high of ₹528.55. The share price has increased in really good manner in accordance with its financial and the volatility is in normal range but the trade volumes have increased in recent times.