JB Chemicals & Pharma Ltd
JB Chemicals & Pharma Shares in Spotlight as KKR Plans to Offload 10.2% Stake

Business and Industry Overview: 

J B Chemicals and Pharmaceuticals Ltd (JBCPL) is a leading Indian medicine company. It has been making quality medicines for 47 years. It is one of the top 25 pharmaceutical companies in India. The company makes 350+ medicines for 20+ health problems. These include heart diseases, stomach issues, infections, and pain relief. Some of its famous brands are Rantac (for acidity), Metrogyl (for infections), and Nicardia (for high blood pressure). JBCPL has 5000+ employees. They work in 10 offices across India. JBCPL has 8 modern factories in India. These factories follow strict quality rules set by global health agencies. One of these factories is specialised in making lozenges (medicated throat candies). The company also sells medicines in over 40 countries. Some of its biggest markets are Russia, South Africa, and the U.S. In the last three years, JBCPL has been the fastest-growing pharma company in India. It has grown by launching new medicines, acquiring other brands, and expanding into new countries. The company has a strong financial position. It invests in research, technology, and high-quality production. JBCPL continues to grow and improve healthcare in India and around the world. 

The pharmaceutical industry makes medicines that treat diseases and help people live healthier lives. This industry is growing fast because healthcare needs are increasing. New technology helps companies develop better medicines for different diseases. India is a major player in the global pharmaceutical industry. It is known as the “Pharmacy of the World” because it makes high-quality medicines at affordable prices. India is the world’s largest supplier of generic medicines. Generic medicines are cheaper versions of branded medicines, but work the same. India also produces low-cost vaccines that are used in many countries. One of India’s greatest achievements is providing affordable HIV treatment. This has saved many lives worldwide. India also makes affordable vaccines that help protect people from diseases. Because of this, India is important in global healthcare. India’s pharmaceutical industry is strong because of low manufacturing costs. It costs 30% to 35% less to make medicines in India compared to the US and Europe. Research and development (R&D) costs are also much lower in India—87% less than in developed countries. This helps make medicines affordable for more people. The country has many skilled workers, but their salaries are lower than in other countries, which keeps production costs down. The Indian pharmaceutical market is growing. By 2030, it is expected to be worth $130 billion. By 2047, it could reach $450 billion. The government is helping by providing support to increase production and attract investment. One of the ways it helps is through the Production-Linked Incentive (PLI) scheme. This scheme encourages companies to produce more medicines and create more jobs. The government also helps small pharma companies improve their products through the Strengthening of Pharmaceutical Industry (SPI) Scheme. India makes it easy for foreign companies to invest in the pharmaceutical sector. India allows 100% foreign investment in new pharma projects. Since 2000, India has received $22 billion in foreign investments for pharmaceuticals. This shows that foreign companies trust India’s pharma industry. India’s pharmaceutical companies sell medicines to many countries, including the US and Europe. India has the largest number of USFDA-approved factories outside the US. It also has over 2,000 WHO-GMP-approved factories, meaning the medicines made in India meet high international standards. With the help of the government, low costs, and new technology, India’s pharmaceutical industry will continue to grow and provide affordable medicines to people all around the world. 

JB Chemicals and Pharma Ltd. is a leading company in the medicine industry. It makes a wide variety of medicines for different health problems. The company has modern factories in India. These factories meet international standards, which ensure the quality of their medicines. JB Chemicals sells its products in more than 40 countries. Some of the biggest markets include the US and South Africa. The company can keep production costs low. This allows it to offer high-quality medicines at affordable prices. JB Chemicals focuses on creating new medicines. It also works on improving its existing products. This helps the company stay ahead in the market. The company has strong business partnerships. These partnerships help JB Chemicals reach more customers and grow faster. JB Chemicals is known for its reliable healthcare products. People trust the company for its quality and consistency. The company is growing quickly in both India and abroad. It continues to make medicines that help people live healthier lives. 

Latest Stock News: 

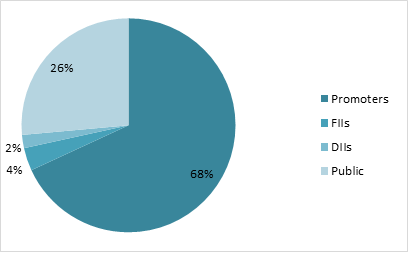
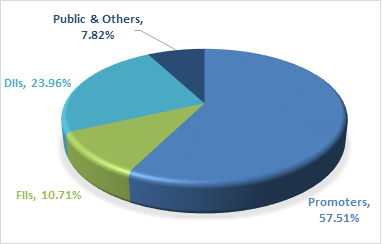
Tau Investment Holdings, a company connected to KKR, sold shares of JB Pharma. They sold 89.83 lakh shares, which is 5.78% of the company. Before selling, they owned 53.66% of JB Pharma. After the sale, their ownership dropped to 47.88%. The shares were sold for ₹1,625 each. This price was slightly lower than the previous day’s price. Even after selling the shares, Tau Investment Holdings still holds a big part of the company. JB Pharma gave 1,700 new shares to employees. These employees had been given stock options as a benefit from the company. They were able to buy these shares at a price. The company received ₹13,32,500 from this process. As a result, the total number of shares in the company increased from 15,56,75,508 to 15,56,77,208. JB Pharma’s manufacturing facility in Gujarat was inspected by the USFDA (U.S. Food and Drug Administration). The inspection took place from March 10 to March 13, 2025. After the inspection, the USFDA found no issues. This means the company is meeting all the required standards for making its products. JB Pharma received a great score for its work on sustainability. The Dow Jones Sustainability Index (DJSI) gave the company a score of 77. The DJSI is a list of the world’s top companies for sustainability. This score shows that JB Pharma is among the best in India and the world for its efforts on the environment and social responsibility. The company has worked on many projects, such as using renewable energy, saving water, reducing waste, and supporting communities. These actions helped JB Pharma earn this high score. 

In summary, JB Pharma is doing well in business. The company is following good quality standards, and it cares about the environment and society. They are also helping their employees and making sure their manufacturing facilities meet the highest standards. 

Potentials: 

JB Pharma wants to become a leader in the medical industry. They plan to make new medicines and improve the ones they already have. The company is focusing on expanding its market reach and selling more products worldwide. They are working hard to grow in international markets. Currently, they are strong in Russia, South Africa, and the United States. They want to expand further into these regions and other places like Europe, Southeast Asia, the Middle East, and Brazil. This will allow more people to use their products. The company is also investing in new factories. They plan to build modern factories to meet the increasing demand for their medicines. They will also upgrade the ones they already have. This will help them keep the quality of their products high. JB Pharma cares about the environment and society. They are working to reduce their impact on the environment by using renewable energy and reducing waste. The company is also focused on helping local communities and being responsible in its operations. In the next two years, JB Pharma plans to increase its revenue by 12-14%. They want to achieve this by growing their chronic medicine products and their contract manufacturing business. This will help the company become more profitable. Each year, JB Pharma plans to launch 6 to 8 new products in India. Some of these products include an iron syrup and a dental probiotic. These products are expected to bring in a lot of revenue for the company. The company also wants to grow its contract manufacturing business. JB Pharma plans to double its revenue from this business in the next 3 to 5 years. They are already one of the top manufacturers of lozenges and sell them in over 40 countries. Additionally, JB Pharma is looking to buy other companies in different areas of healthcare, like heart care, eye care, children’s health, and digestive health. They recently bought some eye care products from Novartis, which will help them expand in this field. JB Pharma is committed to sustainability. They have reduced their energy use by 9% and are now using renewable energy in their operations. The company will continue to focus on sustainability in the future. Overall, JB Pharma’s plans focus on growing their market, improving their products, and being a responsible company that cares for the environment and society. 

Analyst Insights: 

  • Market capitalisation: ₹ 25,352 Cr. 
  • Current Price: ₹ 1,628 
  • 52-Week High/Low: ₹ 2,030 / 1,434 
  • Stock P/E: 39.6 
  • Dividend Yield: 0.75%
  • Return on Capital Employed (ROCE): 24.6% 
  • Return on Equity (ROE): 20.0% 

J.B. Chemicals & Pharmaceuticals Ltd (JBCPL) is a strong company that has been growing well. In the last year, its sales and profits grew by 25%. This means the company is doing better and earning more money. The company makes good profits. It has a profit margin of 26%, which shows it is good at keeping costs low and making money. This is a good sign. JBCPL also gives good returns to investors. It has a return on equity (ROE) of 20%. This means the company is using its money well to make profits. It also gives a good return on capital, which shows it is managing its money smartly. The company has low debt. This is important because it means the company does not owe a lot of money. Low debt makes the company safer and more stable. JBCPL earns money in different ways. 55% of its income comes from selling products in India, while 30% comes from selling products in other countries. It also earns 13% from making products for other companies. This helps the company stay stable. The company pays a small dividend to its investors. Even though the stock is priced higher than its book value, JBCPL’s growth and strong financial health make it a good investment. To sum up, JBCPL is a good company to invest in. It has strong profits, low debt, and is growing well. It is a safe and stable choice for people who want steady growth and small dividends. 

Jupiter Wagons Ups Stake
Jupiter Wagons Ups Stake in Electric Mobility to 75%, Eyes Railway Growth

Jupiter Wagons Limited: Overview 

Jupiter Wagons known as Commercial Engineers & Body Builders Company Ltd is involved in business of metal fabrication of load bodies for commercial vehicles, rail freight wagons and its components. The rail mobility business is for open, flat, covered, defence wagons and wagon accessories, passenger coach accessories, wheel sets and track solutions. It also makes water tankers, BESS container, data center containers, marine containers, brake systems and discs, etc. Railway wagons contribute about 84% of the company’s revenue and commercial vehicle load bodies and components about 11%. The order book of company is ₹7000+ crores with the clientele of Tata Motors, Mahindra, JSW Steel, Adani Ports and Logistics, etc. The company has total 12 manufacturing facilities in India, with a production capacity of 8000 wagons per year. 

Latest Stock News (7 Jan 2025) 

Jupiter Wagons Ltd. has its subsidiary Jupiter Electric Mobility Pvt Ltd. with stake of 60% and on December 31st Jupiter Wagons Ltd has increased their stake by 15% to 75% of its paid-up share capital. Jupiter Wagons with other railway stocks has risen up by 7%-10%, hoping a recovery in central government capex and major announcements from the Union Budget for railway sector. 

Shareholding Pattern as on September 2024 

Key Stats 

Market Cap ₹20304 Crore 
Revenue ₹3877 Crore 
Profit ₹365 Crore 
ROCE 31.67% 
P/E 55.56 

Peer Comparison 

Amt in ₹ Cr MCap Sales PAT ROCE Asset Turn. EV/EBITDA D/E P/E 
Jupiter Wagons 20304 3877 365 31.67% 1.64 35.9 0.16 55.56 
Titagarh Rail 14642 3967 304 24.97% 1.47 28.94 0.21 48.2 
Jyoti CNC Auto 30583 1620 274 21.22% 0.72 69.4 0.17 111.4 
Texmaco Rail 7582 4475 208 10.59% 0.93 17.84 0.35 36.5 

Financial Trends 

Amount in ₹ Cr 2020 2021 2022 2023 2024 
Revenue 127 82.9 105 123 87.9 
Expenses 114 72 95.8 113 80.2 
EBITDA 12.38 11.3 9.6 10.25 7.7 
OPM 10% 14% 9% 8% 9% 
Net Profit 7.62 7.9 7.4 8.08 5.5 
NPM 6.0% 9.5% 7.0% 6.6% 6.3% 
EPS 4.56 4.75 4.4 4.83 3.3 

Stock Price Analysis 

In terms of performance, Jupiter Wagons has shown a return of -5.71% in one day, -2.81% over the past month, and -2.14% in the last three months. Over the past 52 weeks, the shares have seen a low of ₹301 and a high of ₹748.05. As the railway industry in major eyesight, the stock has rallied great and the volume traded has increased compared to the past. There is some fluctuation in stock but before Union Budget there is a chance for rally in stock in short term.

UltraTech Cement and Ambuja Cements
Future of Cement in India: Key Updates and 2025 Growth Outlook

The Indian cement industry is poised for growth in 2025, expecting improved sales realizations, higher margins, and accelerated demand. This optimism is largely fuelled by government infrastructure spending and the ongoing consolidation within the industry, driven by two major players: UltraTech Cement (part of the Aditya Birla Group) and Ambuja Cements (led by billionaire Gautam Adani). 

Key Developments in the Cement Sector: 

  • Acquisitions and Capacity Expansion: Both UltraTech Cement and Adani’s Ambuja Cements are making substantial investments to expand their market share. Together, they are acquiring over 50 million metric tons per annum (MTPA) capacity for approximately USD 4.5 billion. Adani Cement, which entered the sector relatively recently, has significantly expanded its footprint by acquiring several cement companies, including Saurashtra-based Sanghi Industries and Penna Industries, and a recent agreement to acquire CK Birla Group’s Orient Cement. With these acquisitions, Adani Cement crossed a 100 MTPA capacity, and plans are in place to reach 140 MTPA by FY28, nearly matching UltraTech Cement’s 156.66 MTPA capacity. 
  • Consolidation and Industry Leadership: The cement sector is seeing increased consolidation, with UltraTech Cement and Ambuja Cements collectively controlling a significant portion of India’s cement production capacity. In fact, the top five cement producers now account for approximately 60–65% of the industry’s total capacity. UltraTech Cement, aiming to maintain its lead, plans to reach 200 MTPA capacity by FY27, underscoring its aggressive growth strategy. 

Industry Challenges and Trends in 2024: 

  • Declining Cement Prices: The first half of FY25 saw a 10% year-on-year decline in cement prices, with the average price dropping from Rs 365 per bag in FY24 to Rs 330 per bag. This price drop reflects challenges within the industry, including moderate capacity utilization and lower sales realizations. Despite this, cement prices recovered on a month-to-month basis, rising by 2% in September 2024 compared to the previous month. 
  • Lower Growth in 2024: Cement industry growth in 2024 slowed to around 4.5–5.5%, compared to a more robust 10% growth in previous years. This slowdown was attributed to several factors: A prolonged heatwave and labour shortages during general elections. Seasonal monsoon disruptions that affected construction activity. 
  • Capacity Utilization and Volumes: Capacity utilization levels remained moderate at 70%, as several players struggled with underutilized capacity due to slow growth in demand and the impact of low cement prices. However, the industry’s outlook for the second half of FY25 is more optimistic, with expectations of a 4-5% increase in cement volumes driven by higher rural consumption, increased urban housing demand, and a boost in government infrastructure spending. 

Outlook for 2025 and Beyond: 

  • Government Infrastructure Push: A significant boost to the sector is expected from the government’s increased expenditure on infrastructure projects. This is anticipated to drive a rise in cement demand, especially in the housing and rural sectors. The industry’s growth is also being supported by higher capital expenditure from both the government and private sector players, which is likely to result in greater cement consumption. 
  • Capacity Additions and Expected Growth: The Indian cement industry is adding 35 MTPA of capacity in FY25, with an additional 70-75 MTPA capacity expected to come online in FY25-26. Despite this, overall capacity utilization is expected to remain moderate at 70% due to a lag in demand catching up with supply. The Cement Manufacturers’ Association (CMA) forecasts that cement volumes will grow by 4-5% year-on-year, reaching 445-450 million MT in FY25. 
  • Industry Transformation: The cement industry is undergoing a transformation, driven by a growing emphasis on sustainability, innovations, and increased demand for both housing and infrastructure. The Indian cement market, which now has a total capacity of 690 million tonnes, is expected to see improved price realizations and better capacity utilization in the coming years. 
State Bank of India Ltd
State Bank of India Ltd: Leading the Way in Banking Innovation and Growth

Company Overview 

State Bank of India: A Leading Multinational Banking Institution 

Established on July 1, 1955, following the nationalization of the Imperial Bank of India, the State Bank of India (SBI) is India’s largest multinational public sector bank, headquartered in Mumbai. Formed with the Reserve Bank of India initially acquiring a 60% stake, SBI has grown into a cornerstone of the Indian financial system. 

SBI offers a comprehensive range of financial solutions through four primary segments: Treasury, Corporate/Wholesale Banking, Retail Banking, and Other Banking Business. Its extensive network, consisting of over 22,000 branches across India and 227 international offices in 30 countries, supports global financial operations from hubs like New York, Tokyo, and London. As a leader in digital innovation, SBI has introduced initiatives like SBI e-tax for online tax payments and the Virtual Debit Card, enhancing customer security and convenience. 

The bank has experienced significant growth and expansion through strategic acquisitions, notably the 2017 merger with five associate banks and the Bharatiya Mahila Bank, which solidified its domestic dominance. Internationally, SBI has forged global collaborations, including a Payments Bank partnership with Reliance Industries and ventures with Visa and Elavon for merchant acquiring services. Its subsidiaries, such as SBI Life Insurance, a joint venture with Cardif S.A., and SBI Funds, recognized as ‘Mutual Fund of the Year,’ underscore its excellence in insurance and asset management. 

SBI actively supports national development initiatives through specialized products like the Defence Salary Package and senior citizen loans. By leveraging technology-driven services, it ensures seamless financial solutions for customers across both urban and rural areas. With its strong domestic foundation and growing international presence, SBI continues to cement its role as a leader in the global banking sector. 

Returns Summary 

YTD 1 Month 6 Month 1 Year 2 Year 3 Year 5 Year 
33.02% 4.01% -5.72% 49.33% 40.56% 80.46% 154.00% 

Result Highlights 

  • State Bank of India (SBI) demonstrated a strong performance in Q2FY25, showcasing growth in profitability, business expansion, asset quality, and digital transformation. The bank reported a Net Profit of ₹18,331 crores, reflecting robust earnings. Key profitability metrics like Return on Assets (ROA) at 1.13% and Return on Equity (ROE) at 21.78% for H1FY25 underscore efficient capital utilization, while the Net Interest Margin (NIM) of 3.18% (3.31% domestic) highlights sustainable profitability. 
  • SBI’s business growth remained impressive, with deposits crossing ₹51 trillion, up 9.13% YoY, and advances exceeding ₹39 trillion, registering a 14.93% YoY growth. This reflects balanced expansion across deposits and credit segments, positioning SBI for competitive market share growth. Asset quality improved significantly, with Gross NPA at 2.13% and Net NPA at 0.53%, supported by a Provision Coverage Ratio (PCR) of 75.66%, rising to 92.21% when including AUCA. Additionally, the bank maintained conservative provisioning, setting aside ₹31,084 crores, equivalent to 153% of Net NPAs, ensuring resilience against potential losses. 
  • SBI’s digital transformation continues to lead, with >98% of transactions via alternate channels and over 8.13 crore users on its YONO app. Notably, 61% of savings accounts were opened digitally in Q2FY25, highlighting the platform’s pivotal role in customer acquisition and engagement. The bank’s liability franchise benefits from its 22% market share in deposits, with 10.05% YoY growth in current account balances, and a credit-to-deposit ratio of 67.87%, reflecting healthy lending activity. 
  • To support future growth, the Central Board approved raising up to ₹20,000 crores in long-term bonds in FY25. This capital infusion, through public or private placement, will enhance the bank’s capital base, supporting its strategic goals of credit expansion and financial stability, while sustaining a balanced credit-to-deposit ratio. These initiatives position SBI for stable, long-term growth in a competitive banking landscape. 

Shareholding Pattern 

Return Comparison with Peers 

Company ROCE 6 Months 1 Year 3 Year 5 Years 
State Bank of India 6.16% 4.53% 43.59% 21.75% 20.49% 
Bank of Baroda 6.33% -5.34% 21.77% 42.16% 20.01% 
Punjab National Bank 5.46% -12.86% 28.92% 41.02% 11.63% 
IOB 5.41% -18.30% 32.48% 37.16% 39.38% 
Union Bank of India 6.55% -12.79% 10.39% 39.99% 16.74% 
Canara Bank 6.63% -10.92% 23.11% 36.54% 19.29% 
Indian Bank 5.92% 6.88% 41.61% 59.60% 36.32% 

SBI Outlook and Contribution to Industry 

State Bank of India (SBI) stands as a cornerstone of the Indian banking sector, with a ₹52 lakh crore balance sheet and a 22% market share in deposits. It dominates segments like home loans (26.5%) and auto loans (19.8%), supported by its 22,000 domestic branches and operations in 30 countries. SBI’s YONO digital platform drives innovation, handling 66 crore transactions annually, reflecting its leadership in technology-driven banking. 

The industry outlook for FY25 and beyond is positive, with GDP growth at 6.7% in Q1 FY25, stable global conditions, and robust banking sector projections of 11-12% deposit growth and 12-13% credit growth. SBI leads this momentum, achieving ₹51.17 trillion in deposits and 14.93% credit growth YoY, backed by a strong capital adequacy ratio of 13.76% and high asset quality (Gross NPA at 2.13%)

Digital transformation remains a key driver, with over 8 crore digital users and 61% of savings accounts opened digitally in Q2 FY25. Its subsidiaries, such as SBI Life Insurance and SBI Funds, diversify its revenue streams, bolstering financial stability. 

SBI’s focus on sustainable growth, digital innovation, and robust asset management positions it to capitalize on India’s economic momentum, ensuring long-term leadership and enhanced shareholder value. 

Balance Sheet Analysis 

SBI’s balance sheet from FY20 to FY24 shows steady expansion in key financial areas. Deposits grew from ₹32,74,160.63 crores to ₹49,66,537.49 crores, reflecting the bank’s strong customer base and competitive edge in attracting funds. Simultaneously, advances saw a significant rise, from ₹23,74,311.18 crores to ₹37,84,272.67 crores, driven by robust growth across corporate, retail, and MSME sectors. The bank has also shown consistent growth in reserves, increasing from ₹2,50,167.66 crores to ₹4,14,046.71 crores, indicating a strong capital base to support long-term sustainability. Borrowings grew from ₹3,32,900.67 crores to ₹6,39,609.50 crores, signifying  

SBI’s use of external funding to drive its growth. While this increase reflects SBI’s expansion, effective asset-liability management remains critical. Investments and other assets also rose significantly, supporting SBI’s diversified portfolio. The net block remained stable, reflecting a balanced approach to capital expenditure in fixed assets. With strong asset growth and prudent liability management, SBI is well-positioned for continued market leadership in India’s banking sector, strengthened by its digital transformation through platforms like YONO

Cash Flow Analysis 

SBI’s cash flow analysis from FY2013 to FY2024 reveals significant fluctuations in its operational, investing, and financing activities. Operating cash flows have been largely positive, with notable spikes in FY2017 (+₹77,406 crores) and FY2022 (+₹89,919 crores), reflecting strong operational efficiency. However, negative flows in FY2018 and FY2023 highlight challenges such as higher provisioning for bad loans. In terms of investing activities, cash flows have consistently been negative, with the bank investing heavily in growth, technology, and acquisitions. A rare positive period in FY2018 likely reflects asset disposals. Financing activities show volatility, with positive cash inflows in certain years due to capital raising and negative flows in others, such as FY2024, likely reflecting debt repayments and a focus on capital strengthening. Despite these fluctuations, SBI has managed to maintain positive net cash flow in key years, ensuring liquidity for growth. Overall, SBI’s cash flow patterns reflect strategic financial management, including debt reduction and investment in expansion, positioning it for long-term growth