Sonata Software Ltd. is a leading global IT services and technology solutions company based in India. It provides a wide array of IT services, software solutions, and digital transformation offerings to enterprises worldwide. With a focus on innovation and customer-centricity, the company caters to industries such as retail, manufacturing, travel, ISV (Independent Software Vendors), and BFSI (Banking, Financial Services, and Insurance). It has business segments in IT services, platformation, Product Engineering, and software Distributors. It has a global presence with operations in over 35 countries, serving more than 500 clients.
Return Summary
YTD
1 Month
6 Month
1 Year
2 Year
3 Year
5 Year
(15.73%)
4.75%
15.07%
(0.15%)
113.87%
111.02%
444.02%
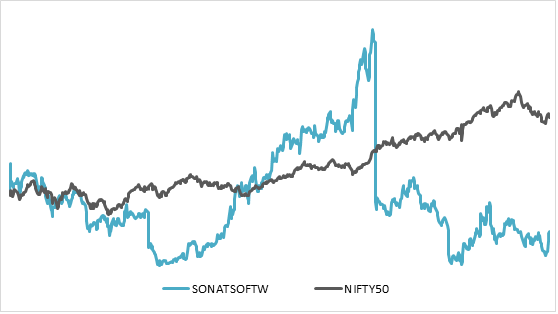
3 Year Return: Sonata Software v/s NIFTY
Result Highlights
Revenue for YoY and QoQ is at increasing phase at Q2 FY25 revenue of ₹2527 crore with moderate EBITDA margin of 7% at ₹176 crore.
The target revenue company want to achieve is ₹12,000 crore by the end of 2027, and strengthening its client partnerships with Microsoft, AWS and other significant players.
In this half year company has closed 6 large deals, and in active pipeline 49% are large orders.
The cash reserves on balance sheet has reduced from ₹700 crore to ₹500 crore, because of dividend payouts and acquisitions.
Major wins in Q2 are Collaboration with a US technology giant for AI, cloud, and data services. A multi-year data modernization program with an Australian wholesaler. Strategic partnership with a leader in food safety systems for consumer-facing automation platforms
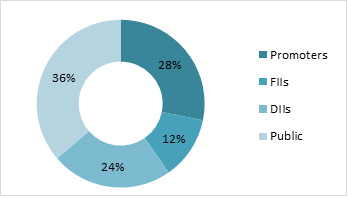
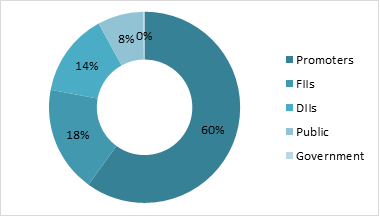
Shareholding Pattern
Return Comparison with Peers
COMPANY
1 Year
2 year
3 Year
5 Year
Sonata Software
(0.15%)
113.87%
111.02%
444.02%
Tata Elxsi
(19.7%)
(1.86%)
14.26%
734.5%
KPIT Technology
(8.12%)
91.47%
196.3%
1341.6%
Newgen Software
75.56%
560.6%
319.2%
1176.5%
Birlasoft
(3.44%)
97.15%
25.32%
745.02%
Contribution to Industry Size
The great partnership for 30+ years of Sonata with Microsoft in the AI industry has helped Sonata grow significantly. It is helping Microsoft with 400+ clients across the globe generating Microsoft’s $650+ million revenue per annum. It has 3500+ teams on Microsoft Technologies, contributing in the industry of healthcare, retail, manufacturing, and Telecom. For corporates, it has made its own AI called Harmoni. AI with Microsoft and AWS as partners.
Balance Sheet Analysis
Reserves have been increasing gradually with high revenues and efficient management operations.
Borrowing has increased year on year to fulfil the expansion and partnerships with clients for projects.
The cash reserves are enough to pay the borrowed debts and acquisitions of companies to grow inorganic way.
The balance sheet is strong and efficient in industry aspects.
Cash Flow Analysis
Cash flow from operations is ₹281 crore in FY24 and is positive for many years.
The acquisitions have increased in the past 2-3 years because of high demand in the industry, showing great strength in the company.
The borrowing has been stable and is very low, maintaining its debt-to-equity ratio.
The company is paying its dividend every year constantly with good payouts to its investors.
Incorporated in 2005, Suraksha Diagnostic Limited has grown into a prominent player in the diagnostic services sector, offering a range of pathology, radiology, and medical consultancy services. The company has announced its Initial Public Offering (IPO) to raise ₹846.25 crore, structured as a book-built issue consisting entirely of an Offer for Sale (OFS) of 1.92 crore shares.
Suraksha Diagnostic operates an extensive network across eastern India, which includes: 1 Central Reference Laboratory, 8 Satellite Laboratories, and 215 Customer Touchpoints, comprising: 49 Diagnostic Centres & 166 Sample Collection Centres.
This robust presence spans key states like West Bengal, Bihar, Assam, and Meghalaya, as of June 30, 2024. The IPO presents an opportunity for investors to engage with a well-established brand in the growing healthcare and diagnostic market in India.
IPO Subscription Period
The IPO subscription period for Suraksha Diagnostic Limited opens on November 29, 2024, and closes on December 3, 2024. The finalization of the allotment is expected by December 4, 2024, with refunds being initiated the same day.
Pricing and Lot Details
The Suraksha Diagnostic IPO presents an opportunity to invest in a leading diagnostic service provider in eastern India. Below are the key details for potential investors:
Price Band: ₹420 to ₹441 per share. The price band represents the range within which investors can place their bids. The lower end is ₹420, while the upper end (or cap) is ₹441.
Lot Size: Investors must purchase a minimum of 34 shares, totaling approximately ₹14,994 for retail investors at the highest price.
Issue Size: The IPO aims to raise ₹846.25 crore, consisting entirely of an Offer for Sale (OFS) of 1.92 crore shares.
Face Value: Rs. 1 Per Equity Share. The face value is the nominal or base value of the share. However, the IPO pricing reflects the premium set above the face value based on the company’s valuation and market demand.
The Suraksha Diagnostic IPO has a structured bidding system for different investor categories. Here’s a breakdown of the investment requirements for retail investors and high-net-worth individuals (HNIs):
Application
Lots
Shares
Amount (Rs)
Retail (Min)
1
34
14,994
Retail (Max)
13
442
1,94,922
Small HNI (Min)
14
476
2,09,916
Small HNI (Max)
66
2244
9,89,604
Large HNI (Min)
67
2278
10,04,589
Reservation Structure
Reservation Structure for Suraksha Diagnostic IPO: The reservation structure for the Suraksha Diagnostic IPO is organized to balance participation from institutional, non-institutional, and retail investors.
Qualified Institutional Buyers (QIBs): 50% of the issue is reserved for QIBs. This category includes entities such as mutual funds, foreign institutional investors, banks, and other large financial institutions.
Non-Institutional Investors (NIIs): 15% of the issue is allocated to non-institutional investors, often high-net-worth individuals (HNIs) who bid in larger lot sizes.
Retail Investors: 35% of the issue is reserved for retail investors. Retail investors can bid for a minimum of 34 shares per lot, requiring an investment of ₹14,994 at the upper price band.
Employee Reservation: There is no specific employee reservation mentioned for the Suraksha Diagnostic IPO.
This well-structured reservation model ensures a fair distribution of the IPO, catering to a wide range of investor categories and encouraging participation across different segments of the market.
Key Dates & Timelines
Suraksha Diagnostic IPO Timeline (November – December 2024)
IPO Open Date: Friday, November 29, 2024
IPO Close Date: Tuesday, December 3, 2024
Basis of Allotment: Friday, December 6, 2024
Initiation of Refunds: Monday, December 9, 2024
Credit of Shares to Demat Accounts: Tuesday, December 10, 2024
Listing Date on BSE and NSE: Wednesday, December 11, 2024
Book Running Lead Managers
The Suraksha Diagnostic IPO is being managed by the following Book Running Lead Managers (BRLMs):
ICICI Securities Limited
SBI Capital Markets Limited
Nuvama Wealth Management Limited
The registrar for the IPO is KFin Technologies Limited, responsible for processing applications and managing allotments.
Promoters Information
Here is the promoter and key management information for the Suraksha Diagnostic IPO:
Dr. Somnath Chatterjee: Chairman and Joint Managing Director of Suraksha Diagnostic Limited. He is a medical graduate from the University of Calcutta (1985) with over 32 years of experience in the medical and diagnostics industry. Dr. Chatterjee has been associated with the company since its inception and is responsible for overall planning and business strategies.
Ritu Mittal: Joint Managing Director and CEO. A commerce graduate from the University of Calcutta (1996), she has over 28 years of experience in the medical and diagnostics sector, including her association with Suraksha Diagnostic & Eye Centre Private Limited. She oversees the company’s operations end-to-end.
Satish Kumar Verma: Non-Executive, Non-Independent Director. He is a mechanical engineering graduate from Punjabi University (1969) with a postgraduate diploma (1971). With over 40 years of management experience, he also serves as a director at Kanika Audio Visuals Private Limited and oversees strategic planning and customer relationship management.
Institutional Investors: The IPO includes the sale of equity by various stakeholders, including Orbimed Asia II Mauritius Limited, which acts as a key investor selling shareholder. The total offer includes shares from promoter shareholders and other individual shareholders as part of the Offer for Sale
About Suraksha Diagnostics Ltd.
Suraksha Diagnostics Limited, the largest integrated diagnostics chain headquartered in East India, provides a comprehensive range of services that include pathology and radiology testing, as well as medical consultation services. As of March 31, 2024, the company operates 48 diagnostic centers and 146 sample collection centers across West Bengal, Assam, Bihar, and Meghalaya, making it a leader in its region.
The company boasts a technologically advanced infrastructure with a central reference laboratory, eight satellite laboratories, and 215 customer touchpoints, including 49 diagnostic centers and 166 sample collection centers. Its offerings include over 2,300 tests, ranging from routine pathology (788 tests) to specialized pathology (647 tests), and basic/intermediate radiology (748 tests) such as X-rays, CT scans, MRIs, and ultrasounds. Additionally, it supports its operations with robust systems like Laboratory Information Management System (LIMS), Radiology Information System (RIS), Picture Archive Communication System (PACS), and Enterprise Resource Planning (ERP) tools, ensuring efficiency and quality.
The company places a strong emphasis on quality certifications. Three laboratories hold NABL certification, and two advanced diagnostic centers are accredited by the National Accreditation Board for Hospitals & Healthcare Providers (NABH). Its high brand recall, superior service quality, and strong management team further enhance its reputation.
Suraksha Diagnostics derives most of its revenue (94% in Fiscal 2024) from the B2C segment, reflecting its dominant consumer reach. It also offers online and offline medical consultations through 44 diagnostic centers, which house 120 polyclinics with over 750 doctors.
According to a CRISIL report, India’s diagnostic service market is expected to grow at a CAGR of 10%-12%, reaching ₹1,375 billion by Fiscal 2028 from ₹870 billion in Fiscal 2024. This presents a significant growth opportunity for Suraksha Diagnostics to expand its footprint.
Key Strengths:
Largest diagnostic chain with a stronghold in East India.
Proven track record of profitability and consistent financial performance.
Comprehensive, one-stop solution for diagnostics combining pathology, radiology, and consultations.
Utilization of advanced technology platforms for operational excellence.
Strong brand positioning and quality-focused services since its inception in 2005.
Suraksha Diagnostics’ robust network, quality services, and market leadership position it to capitalize on the growing demand for diagnostic services in India.
Suraksha Diagnostics faces several challenges that could impact its operations and market position. Its heavy reliance on West Bengal makes the company vulnerable to regional disruptions, potentially affecting business continuity. Health epidemics pose a dual threat by affecting both workforce availability and service delivery. The risk of sample handling errors could compromise diagnostic accuracy and damage its reputation. Moreover, franchisee non-performance may negatively influence service quality and financial outcomes.
The company’s dependence on third-party vendors for critical diagnostic equipment introduces the possibility of supply chain disruptions, hindering operations. Additionally, failure to adopt new technologies could result in losing competitiveness and market share in the rapidly evolving diagnostics industry. These factors collectively highlight the importance of effective risk management strategies to sustain and grow its market position.
Financial Highlights
INR in Crores
31-Mar-24
31-Mar-23
31-Mar-22
Revenue from Operation (in ₹ Cr.)
218.71
190.13
223.19
Profit After Tax (PAT) (in ₹ Cr.)
23.127
6.065
20.824
Total Borrowings (in ₹ Cr.)
8.637
14.007
19.027
Net Worth (in ₹ Cr.)
179.41
155.93
145.84
Return on Capital Employed (%)
21.46
9.05
23.11
Return on Equity (%)
14.09
4.32
15.38
Earnings Per Share (EPS)-in absolute ₹
4.43
1.22
3.91
KPI’s as on 31-Mar-24
Value
ROCE
21.46%
Debt/Equity
0.2
RoNW
14.09%
P/BV
13.1
PAT Margin (%)
10.57
ROE
14.09%
IPO Objectives
The proceeds from the Suraksha Diagnostic IPO will not be allocated to operational expansion or growth initiatives. Instead, the offering is structured as an offer-for-sale (OFS), enabling existing shareholders to divest their stakes and exit their investments. The company itself will not receive any funds from the IPO. This approach primarily aims to provide liquidity to the selling shareholders while facilitating the listing of the company’s shares on the stock exchanges.
UltraTech Cement Ltd., a flagship company of the Aditya Birla Group, is India’s largest manufacturer of grey cement, ready-mix concrete (RMC), and white cement. Established in 1983, the company has a strong presence across India, UAE, Bahrain, and Sri Lanka. UltraTech operates 23 integrated manufacturing units, 28 grinding units, and 7 bulk terminals, making it a leading player in the global cement industry. It has installed cement manufacturing capacity of approximately +140 million tonne per annum and has employee strength over 23000 in FY24. UltraTech is a pioneer in sustainability initiatives, with a focus on reducing carbon emissions, renewable energy adoption, and circular economy practices. It is committed to achieving carbon neutrality by 2050.
Return Summary
YTD
1 Month
6 Month
1 Year
2 Year
3 Year
5 Year
4.58%
-0.97%
7.91%
25.87%
59.37%
48.54%
155.7%
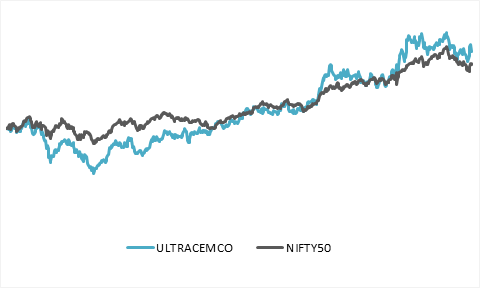
3 Year Return: UltraTech Cement v/s NIFTY
Result Highlights
Revenue of ₹15,635 in Q2 and EBITDA of ₹2017, which is multi quarter low because of monsoon season, election pressure and high cost compared to revenue.
UltraTech Cement’s capacity utilization at 68% with 3% growth in volume terms for Q2 FY25.
The high-cost fuel contracts are at end and by Q3 the prices will further go down and costs dropping to ₹1.84 per Kcal, down 8% QoQ.
Government focus on Metros, Roads, and Housing schemes will benefit cement companies.
The company will be expanding its capacity by 8 million tons reaching 158 million tons capacity.
The Kesoram Cement acquisition at ₹7500 crore, and it will strengthen and expand the south market footprint and will reach the target of total capacity of 200 million tons by 2028.
Shareholding Pattern
Return Comparison with Peers
COMPANY
1 Year
2 year
3 Year
5 Year
UltraTech Cement
26.03%
59.57%
48.72%
156.08%
Ambuja Cement
18.97%
(9.75%)
37.77%
150.30%
Shree Cement
(2.00%)
9.05%
(1.54%)
20.58%
JK Cements
16.05%
37.46%
27.79%
258.90%
JK Lakshmi Cements
(1.39%)
15.34%
23.17%
173.19%
Contribution to Industry Size
Being the largest cement company in Cement industry, UltraTech Cement with ₹318,000 crore market capitalizations having 24% market share of the industry. Expanding its footprint and having highest market share in North, South, West and East of India. Promoting the use of renewable energy resources for its production process and reducing the use of coal and pet coke. The company extensive operations include 23 integrated plants, 28 grinding units and 7 bulk terminals, enabling to serve the market efficiently.
Balance Sheet Analysis
Reserves, fixed assets and capex is increasing every year, showing a great sign of growth.
Company has debt on its balance sheet but has enough cash to pay it, hence it is net debt free.
The excess cash is used to acquire new business to have more growth through inorganic way as business is at mature stage to grow fast.
Cash Flow Analysis
Cash flow from Operations is ₹10,898 crore in FY24 and is positive for more than 10 years.
Purchase of fixed assets is in increasing trajectory every year on year, showing a great sign of expansion and growth of company.
The borrowing has been stable and is very low maintaining its debt to equity ratio.
India has earned the title of the “Pharmacy of the World” due to its unparalleled contributions to the global supply of affordable medicines, particularly during the COVID-19 pandemic. The country’s role in vaccine distribution and the production of essential drugs during this period has further cemented its reputation as the “Healers of the World.” These achievements highlight India’s critical role in addressing global healthcare needs by providing low-cost and high-quality medical solutions.
Current Industry Status
The Indian pharmaceutical industry, valued at $55 billion, is a key player in the global healthcare sector. It accounts for an impressive 20% of the world’s generic drug supply and fulfils 60% of the global vaccine demand, demonstrating its dominance in these areas. This success is attributed to India’s cost-effective manufacturing processes, skilled workforce, and strong infrastructure.
Future Projections
India’s pharmaceutical sector is set for remarkable growth, expected to reach $130 billion by 2030 and a staggering $1 trillion by 2047. This unprecedented expansion reflects the industry’s potential to transform into a global healthcare innovation hub. It will likely reinforce India’s leadership in drug discovery, manufacturing, and distribution, benefiting millions worldwide.
Global Growth Drivers
The following factors are driving India’s dominance in the pharmaceutical sector:
Low-Cost Manufacturing: India’s ability to produce high-quality drugs at lower costs makes it a preferred global supplier.
Growing Demand for Generics and Biopharmaceuticals: As healthcare costs rise worldwide, the demand for cost-efficient generic drugs and biosimilars is increasing.
Advanced Production Standards: Indian manufacturers adhere to strict quality protocols, earning trust in regulated markets like the US, Europe, and Japan.
Focus on Drug Innovation: India is actively advancing in biologics, innovative drug therapies, and active pharmaceutical ingredients (APIs).
Government Policies and Industry Initiatives
The Indian government is spearheading multiple initiatives to bolster the pharmaceutical industry:
PLI Schemes: Production Linked Incentives (PLI) are being provided to encourage domestic production of APIs and reduce dependency on imports from countries like China.
R&D Investments: Increased focus on research and development is helping India step into niche markets such as gene therapy and immunotherapy.
Industry Collaborations: Partnerships with global pharmaceutical companies are being encouraged to strengthen India’s competitive edge.
Impact on the Indian Stock Market
Sectoral Impact
The pharmaceutical sector is poised to see strong investor interest, with both domestic and international players looking to capitalize on the expected growth. The news is likely to create bullish momentum for pharmaceutical stocks, especially those focused on generics, vaccines, and biologics.
Key Beneficiaries
Major Companies: Sun Pharma, Dr. Reddy’s, Cipla, Biocon, Lupin, and Zydus Lifesciences are positioned to benefit significantly from this growth.
API Manufacturers: Companies like Divi’s Laboratories and Aarti Drugs are expected to gain as India moves towards greater self-reliance in API production.
Innovators: Firms investing in biosimilars, biologics, and cutting-edge research are likely to emerge as market leaders.
Long-Term Opportunities
The $1 trillion milestone by 2047 highlights the sector’s long-term potential, making it a compelling investment avenue for institutional and retail investors alikeBroader Implications for the Economy
Employment Generation: The pharmaceutical industry’s expansion will create millions of jobs across R&D, manufacturing, and logistics.
Boost to Exports: India’s export contribution is expected to grow significantly, further strengthening its foreign exchange reserves and global trade balance.
Healthcare Innovation Hub: With investments in biotechnology, clinical trials, and advanced drug discovery, India is on track to become a leading centre for healthcare innovation.
Conclusion
India’s pharmaceutical industry is entering a golden era, with projections of becoming a $1 trillion global leader by 2047. This growth not only cements India’s role as the pharmacy of the world but also creates vast opportunities for investment, innovation, and employment. By addressing both global and domestic healthcare needs, the sector is set to play a pivotal role in India’s economic and social development in the coming decades. Policymakers and investors must seize this moment to strengthen India’s infrastructure, innovation, and global partnerships, ensuring that the nation sustains its leadership in the pharmaceutical landscape.
Godavari Biorefineries Limited (GBL) is a pioneer in bio-based products with a rich history dating back to its founding in 1940 as The Godavari Sugar Mills Limited. Originally incorporated as Godavari Investment and Finance Corporation Limited in 1956, the company was rebranded in 2006 to align with its shift to biorefinery operations. GBL operates a diversified business spanning sugar production, bio-based chemicals, ethanol, power generation, and other bio-products, leveraging sugarcane as its primary feedstock. GBL was among the first Indian companies to use sugarcane juice and syrup for ethanol production. Its product portfolio includes bio-based chemicals like ethyl acetate, bio-ethyl acetate, MPO, 1,3 butylene glycols, and crotonaldehyde, along with ethanol, sugar, and power. These chemicals serve diverse industries, including agrochemicals, cosmetics, pharmaceuticals, and food, while ethanol is supplied to oil marketing companies, beverage producers, and chemical industries. The company emphasizes sustainability, converting by-products like press mud into fertilizers under the ‘Bhumilabh’ brand and using bagasse for power generation.
Sakarwadi Facility (Maharashtra): Specializes in bio-based chemicals, using ethanol or rectified spirits.
Over its decades-long journey, GBL has achieved notable milestones. It began producing rectified spirits and acetic acid in 1962, alcohol manufacturing at Sameerwadi in 1985, and ethyl acetate at Sakarwadi in 1993. By 2016, the company had introduced innovative products like MPO and 1,3 butylene glycolss, expanding its chemical portfolio.
Godavari Biorefineries Limited (GBL) recently went public with an Initial Public Offering (IPO) worth ₹554.75 crores. The IPO was structured as a book-built issue, comprising a fresh issue of ₹325 crores (0.92 crore shares) and an offer for sale of ₹229.75 crores (0.65 crore shares). The funds are being utilized to strengthen its position in the bio-economy sector and finance its expansion plans, reflecting the company’s strategic focus on growth and sustainability. Positioned as a leader in renewable and bio-based products, GBL’s diversified operations ensure resilience across multiple industries, from energy and chemicals to food and pharmaceuticals.
Industry Outlook
The bio-based chemicals industry is witnessing rapid growth, driven by the increasing need for environmentally sustainable solutions. The global biochemical market, valued at USD 10.4 billion, is projected to grow at an impressive CAGR of 10.4%, indicating strong expansion potential. This growth is supported by several factors, including the shift towards natural products, rising demand for sustainable ESG sourcing, and a focus on better control of feedstock supply chains. Additionally, the ban on hazardous chemicals and favorable government policies promoting eco-friendly alternatives further strengthen the industry’s outlook.
For Godavari Biorefineries Limited (GBL), this sector growth presents a significant opportunity. With its established presence in bio-based chemicals, ethanol, and renewable energy, GBL is well-positioned to capitalize on this demand. The company’s focus on natural ingredients, including bio-ethyl acetate and 1,3 butylene glycol, aligns with the increasing preference for sustainable solutions across industries like cosmetics, pharmaceuticals, and agrochemicals. Furthermore, GBL’s integrated operations and feedstock control (using sugarcane as a primary input) provide it with a competitive edge in ensuring consistent supply and quality.
As global players prioritize bio-based products to meet regulatory requirements and consumer preferences, GBL stands to benefit from these tailwinds. Its investments in innovation and expansion, supported by its recent IPO, position it to scale operations and address the growing demand for sustainable chemicals and energy. The combination of strong market fundamentals, policy support, and the transition toward eco-friendly alternatives underscores a promising sector outlook and a robust growth trajectory for GBL in the evolving bio-economy landscape.
Business Segments
Godavari Biorefineries Limited (GBL) operates through the following business segments, leveraging its integrated biorefinery model:
Sugar Production: Sugar remains a core business segment for GBL, utilizing sugarcane as its primary feedstock. Sugar is produced in its Sameerwadi Facility (Karnataka), which processes sugarcane and generates by-products like molasses and press mud. The sugar produced is sold to domestic and international markets, catering to food and beverage manufacturers.
Ethanol and Alcohol Production: GBL is a pioneer in using sugarcane juice and syrup for ethanol production, catering to India’s growing ethanol-blending program. The company produces ethanol, rectified spirits, and industrial alcohol. Ethanol is supplied to oil marketing companies (OMCs) for fuel blending, beverage companies, and industrial sectors. The Indian government’s E20 target (20% ethanol blending by 2025) creates a strong demand for ethanol, bolstering this segment.
Bio-Based Chemicals: A high-growth segment, GBL produces a range of bio-based chemicals derived from renewable feedstocks. Includes ethyl acetate, bio-ethyl acetate, MPO (Mono Propylene Oxide), 1,3 Butylene Glycol, and crotonaldehyde. These chemicals are used in industries such as cosmetics, pharmaceuticals, agrochemicals, and food. GBL’s focus on sustainable bio-chemicals aligns with global demand for eco-friendly products and regulatory restrictions on hazardous chemicals.
Power Generation: GBL utilizes by-products like bagasse (sugarcane fiber) to generate renewable power. This segment supports the energy needs of GBL’s facilities and contributes surplus power to the grid. Renewable power generation underpins GBL’s commitment to sustainability and reducing its carbon footprint.
Fertilizers and Soil Conditioners: By-products like press mud are converted into organic fertilizers marketed under the brand ‘Bhumilabh.’ These fertilizers cater to farmers, promoting sustainable agriculture practices. This segment reflects GBL’s focus on creating value from waste, contributing to a circular economy.
Specialty Chemicals and Advanced Products (Emerging Focus): GBL is expanding its product portfolio to include specialty bio-chemicals with higher margins and advanced applications. Products like 1,3 butylene glycol, which are used in cosmetics, reflect GBL’s efforts to penetrate high-value markets.
Segment Contributions (FY25 Outlook)
Ethanol and bio-based chemicals are expected to be the key growth drivers, benefiting from favorable government policies and global demand for sustainable alternatives. Sugar continues to provide steady revenue, while power and fertilizers enhance value addition and operational efficiency.
GBL’s diversified portfolio and focus on sustainability, innovation, and renewable solutions position it as a leader in the bio-economy sector, addressing diverse market needs across energy, chemicals, and agriculture.
Key Subsidiaries and Their Information
Godavari Biorefineries Limited (GBL) operates through several key subsidiaries, each contributing uniquely to its growth, market diversification, and sustainability objectives:
Somaiya Agencies Pvt. Ltd. This subsidiary functions as GBL’s marketing and distribution arm, focusing on products such as sugar, ethanol, fertilizers, and bio-based chemicals. It strengthens GBL’s domestic and export operations by efficiently managing logistics and maintaining customer relationships.
Godavari Biorefineries BV (Netherlands) Based in Europe, this subsidiary serves as GBL’s international hub for bio-based chemicals. It is instrumental in marketing and distributing products in regions such as Europe and North America, targeting sectors like pharmaceuticals, cosmetics, and agrochemicals. Its strategic positioning ensures direct access to key global customers, enhancing GBL’s export revenue.
EcoEnergy Solutions Pvt. Ltd. This subsidiary is focused on renewable energy solutions, leveraging bagasse from sugar production for power generation. It supports GBL’s sustainability goals by increasing energy efficiency across facilities and contributing surplus power to the grid.
New Bio-Based Ventures As an emerging entity, this subsidiary specializes in advanced research and innovation in bio-based chemicals. Its primary focus is on developing high-value specialty chemicals like 1,3 butylene glycols, aligning with GBL’s strategy to penetrate niche, high-margin markets.
Bhumilabh Fertilizers Pvt. Ltd. Dedicated to organic fertilizers under the brand ‘Bhumilabh,’ this subsidiary utilizes by-products like press mud from sugar processing. It promotes sustainable farming practices while contributing to GBL’s circular economy model and diversifying its revenue streams.
These subsidiaries collectively enhance GBL’s global presence, focus on innovation, and support sustainability. By leveraging international markets through Godavari Biorefineries BV and fostering eco-friendly practices through EcoEnergy Solutions and Bhumilabh Fertilizers, GBL underscores its commitment to the bio-economy sector. Additionally, the New Bio-Based Ventures subsidiary positions GBL for future growth by prioritizing research and the development of specialized bio-based products.
Q2 FY25 Highlights
Godavari Biorefineries Limited (GBL) recently listed on both the NSE and BSE, with a final issue price of ₹352 per share. The ₹554.75 crore IPO comprised a fresh issue of ₹325 crore and an offer for sale of ₹229.75 crore. A significant portion of the proceeds, amounting to ₹240 crore, was allocated for debt repayment and prepayment, aiming to reduce principal and interest outflows. The remaining funds were earmarked for general corporate purposes, enhancing financial flexibility.
In its year-to-date financial performance, GBL reported revenue from operations at ₹320.95 crore, reflecting a 34% year-on-year growth. Despite the revenue growth, the company faced challenges, with negative EBITDA of ₹31.53 crore, loss before tax of ₹64.11 crore, and net loss of ₹75 crore, driven by operational hurdles.
One of the major impacts stemmed from the Indian government’s restriction on using sugarcane juice for ethanol production during the 2023-24 supply year. However, with the lifting of these restrictions effective November 1, 2024, ethanol production and sales are expected to rebound, contributing to improved performance.
Additionally, GBL has seen a surge in demand for bio-based chemicals, fueled by the global transition towards sustainable solutions. To capitalize on this, the company plans to expand its operations in select bio-based chemical segments by Q4 FY25.
A key positive outcome of the IPO is the planned repayment of ₹240 crore in debt, which will significantly reduce interest outflows, thereby improving free cash flows. These enhanced financial resources are strategically aligned to support expansion in the bio-based chemicals sector, starting in Q4 FY25.
In summary, while GBL faced short-term challenges, including regulatory impacts on ethanol production, the company is poised for recovery. The combination of government policy reversal, growing demand for bio-based chemicals, and strategic debt reduction positions GBL for long-term growth and a stronger foothold in sustainable product markets.
Financial Summary
INR in Cr.
Q2 FY25
Q1 FY25
Q2 FY24
Q-o-Q(%)
Y-o-Y(%)
Revenue from Operations
320.95
522.53
239.31
-38.6%
34.1%
Other Income
1.1
2.75
0.95
-60.0%
15.8%
Total Revenue
322.05
525.27
240.26
-38.7%
34.0%
Cost of Materials Consumed
92.49
128.33
104.96
-27.9%
-11.9%
Purchase of Finished Goods
4.88
5.19
4.04
-6.0%
20.8%
Changes in Inventories of Finished Goods and Work in Progress
171.57
317.91
76.83
-46.0%
123.3%
Gross Profit
53.11
73.84
54.43
-28.1%
-2.4%
GP %
16.50%
14.10%
22.70%
17.0%
-27.3%
Employee Benefits Expense
29.66
30.4
28.62
-2.4%
3.6%
Other Expenses
54.98
52.94
56.42
3.9%
-2.6%
EBITDA
-31.53
-9.49
-30.61
232.2%
3.0%
Depreciation and Amortisation Expense
12.3
12.57
15
-2.1%
-18.0%
EBIT
-43.82
-22.06
-45.61
98.6%
-3.9%
Finance Costs
20.29
19.57
19.55
3.7%
3.8%
Exceptional Items
0
0
0
0.0%
0.0%
PBT
-64.11
-41.64
-65.15
54.0%
-1.6%
Total Tax Expense
-10.89
-15.53
0
-29.9%
0.0%
Profit for the year
-75
-26.11
-65.15
187.2%
15.1%
PAT %
-23.30%
-5.00%
-27.10%
366.0%
-14.0%
EPS
-17.88
-6.22
-15.53
187.5%
15.1%
SWOT Analysis
Strengths
Industry Leadership: Maintains a strong position as a market leader.
Diverse Product Range: Offers a wide variety of products catering to multiple industries.
Integrated Operations: Ensures efficiency through seamless operations across the supply chain.
Renewable Energy Focus: Demonstrates commitment to sustainability and green energy initiatives.
Weaknesses
High Debt Burden: Faces challenges due to significant levels of debt.
Regulatory Dependency: Business performance is highly influenced by changes in government policies.
Financial Strain: Experiences ongoing difficulties in improving financial results.
Opportunities
Growth in Bio-Chemicals: Potential for expansion in bio-based chemical production.
Ethanol Boom: Increasing demand for ethanol presents lucrative growth avenues.
Strategic IPO Utilization: Opportunity to strengthen operations and finances through IPO proceeds.
Threats
Intense Market Competition: Faces stiff rivalry from existing and emerging players.
Raw Material and Price Volatility: Vulnerable to fluctuations in raw material costs and product prices.
Economic Uncertainty: Susceptible to the effects of global and domestic economic slowdowns.
NTPC Green Energy IPO is a book-built issue of Rs 10,000.00 crores. The issue is entirely a fresh issue of 92.59 crore shares.
About NTPC Green Energy Limited
Incorporated in April 2022, NTPC Green Energy Limited is a wholly-owned subsidiary of NTPC Limited. NTPC Green is a renewable energy company that focuses on undertaking projects through organic and inorganic routes. The largest renewable energy public sector enterprise, NTPC (National Thermal Power Corporation Limited), was incorporated on November 7, 1975. The company’s renewable energy portfolio includes solar and wind power, making it easier to generate clean energy. Additionally, the company aims to develop utility-scale renewable energy projects and projects for public sector undertakings (“PSUs”) and Indian corporations. As of June 30, 2024, the company has an energy capacity of 14,696 MW, consisting of 2,925 MW from operating projects and 11,771 MW from contracted and awarded projects. Compared to its peers, NTPC has achieved higher EBITDA margins and PTA margins in the last 2 years. The company is constructing 31 renewable energy projects in 7 states, totaling 11,771 MW. As of June 30, 2024, the workforce comprised 234 employees, and the company utilised the services of 45 contract labourers.
IPO Subscription Period
Open Date: November 19, 2024
Close Date: November 22, 2024
Allotment Date: November 25, 2024
Listing Date: November 27, 2024
Stock Exchanges: BSE and NSE
Pricing Details
Price Band: ₹102 – ₹108 per Share
Face Value: ₹10 per Share
Minimum Lot Size: 138 shares
Investment Requirement:
Retail Investors: Minimum ₹14,904 (138 shares)
Small Non-Institutional Investors (sNII): 14 lots (1932 shares) – ₹208,656
Big Non-Institutional Investors (bNII): 68 lots (9384 shares) – ₹1,013,472
Initiation of Refunds: Wednesday, November 26, 2024
Credit of Shares to Demat: Wednesday, November 26, 2024
Listing Date: Thursday, November 27, 2024
Cut-off time for UPI mandate confirmation: 5 PM on November 22, 2024
Book Running Lead Managers
Niva Bupa Health Insurance Limited has appointed prominent financial institutions as book-running lead managers for the IPO:
IDBI Capital Market Services Limited
IIFL Securities Limited
HDFC Bank Limited
Nuvama Wealth Management Limited
Kfin Technologies Limited has been designated as the registrar for the IPO.
Promoter Information
Promoter: The Promoters of the Company are the President of India, acting through the Ministry of Power, Government of India and NTPC Limited.
Shareholding:
Pre-Issue: 100%
Post-Issue: 89.01%
Financial Highlights
Revenue Growth: Increased by 11 folds from ₹170 crores (FY 2023) to ₹2037.66 crores (FY 2024)
Profit After Tax (PAT): Rose by 100%, reaching ₹344.72 crores in FY 2024
Net Worth: ₹6232 crores
Total Borrowing: ₹12796 crores
Key Performance Indicators (KPIs):
ROE: 7.39%
RoNW: 2.14%
P/BV: 9.89
EPS (Pre-IPO): ₹0.46
EPS (Post-IPO): ₹0.42
P/E Ratio (Pre-IPO): 234.97x
P/E Ratio (Post-IPO): 259.56x
IPO Objectives
The company proposes to utilise the Net Proceeds towards funding the following objects:
Investment in the wholly owned Subsidiary, NTPC Renewable Energy Limited (NREL), for repayment/ prepayment, in full or in part of certain outstanding borrowings availed by NREL
General corporate purpose
Subscription Status (As of November 19, 2024, 7:02:07 PM)
Sobha Limited, formerly known as Sobha Developers Limited (SDL), was incorporated on August 7, 1995, and is headquartered in Bengaluru, India. Founded by Mr. PNC Menon, it is a prominent real estate developer engaged in the construction, development, sale, and management of residential and commercial real estate projects. The company also operates in manufacturing activities related to interiors, glazing, metal works, and concrete products, providing backward integration for its turnkey projects, ensuring quality and operational efficiency. Sobha’s equity shares are listed on the National Stock Exchange (NSE) and BSE Limited, increasing its investor accessibility.
The company’s journey began in September 1997 with the launch of its first residential project, Sobha Sapphire in Bangalore, followed by its first plot development, Harisree Garden in Coimbatore. By 1999, Sobha achieved a significant milestone with the completion and handover of Sobha Sapphire, while also commencing its first contractual project for Infosys Technologies Limited in Bangalore. This marked Sobha’s entry into corporate infrastructure development, establishing a reputation for timely delivery and quality standards. Sobha’s commitment to excellence was recognized with an ISO 9001 certification in 1998, later upgraded to the 2000 series in 2004. In 2003, the company established the Sobha Construction Academy and Research and Development Center, underscoring its focus on innovation. By 2005, Sobha launched a fully automated concrete product division, enhancing its manufacturing capabilities. In 2006, the company transitioned from private to public limited status, receiving a PR1 rating from CARE for its financial discipline.
Expanding its footprint across India, Sobha executed projects in Coimbatore, Mysore, Pune, Chennai, and reinforced its presence in Bangalore. In 2008, the company entered into joint ventures and attracted foreign direct investment (FDI), partnering with TUV Rheinland (India) and securing funding from Pan Atlantic, Dubai for projects in Bangalore South. Sobha has consistently demonstrated growth in residential and contractual projects. By FY 2014, the company developed 6.68 million square feet, increasing to 11.10 million square feet in FY 2016, and completing an impressive 7.78 million square feet by FY 2022. Key projects include SOBHA Dream Acres and SOBHA Forest Edge in Bangalore, SOBHA City in Gurgaon, and SOBHA Waterfront in Hyderabad.
The company’s financial prudence is reflected in strategic share buybacks, with major programs in 2016 and 2017 enhancing shareholder value. Additionally, Sobha expanded its operations by acquiring entities like Sobha Contracting Private Limited and Sobha Interiors Private Limited, further streamlining its business model. Sobha Limited remains a pioneer in India’s real estate sector, known for its superior quality, innovation, and commitment to timely project delivery. Its integrated business model, blending real estate development with backward integration, positions it uniquely in the industry. With a legacy of ambitious projects, Sobha continues to shape the urban landscape while delivering value to its customers and stakeholders.
Industry Outlook
The Indian real estate sector stands as the second-largest employment generator after agriculture, encompassing four key sub-sectors: residential, retail, hospitality, and commercial. Among these, the residential segment leads with dominance, projected to expand from US$ 200 billion in 2021 to an impressive US$ 1 trillion by 2030, increasing its contribution to GDP from 6-7% to 13%. This growth is fueled by economic stability, despite challenges such as global uncertainties and interest rate hikes. The market has witnessed substantial momentum, particularly in Tier 1 cities, driven by urbanization and improved affordability. While the Mumbai Metropolitan Region (MMR) maintains a commanding lead in volume and sales growth, cities like Pune, Bangalore, and Hyderabad are emerging as strong markets, especially for luxury housing.
Sobha Limited, a prominent player in this thriving sector, is well-poised to capitalize on these trends. Its ongoing projects, including Sobha Altus, Sobha Aranya (Gurgaon), and Sobha Neopolis (Bangalore), represent significant opportunities, with several towers yet to be released for sale. Current inventories like Sobha Neopolis, Sobha Crystal Meadows, and Sobha Elysia (Gift City) collectively offer over 1 million sq. ft. of space. Looking ahead, Sobha plans to launch new projects over the next 6-8 quarters, holding an effective share of 80.1% in forthcoming inventory. Sobha’s extensive land bank, encompassing 1,878 acres, is a cornerstone of its growth strategy, with areas under consolidation, monetization, and self-use. Notably, 43 acres in Hoskote are earmarked for future projects. The surge in residential demand since 2021 has driven development activities to a 15-year high, enabling Sobha to focus on timely deliveries and high-quality launches. This strategic positioning aligns with the growing appetite for premium and luxury housing, especially in India’s top cities.
The broader Indian real estate sector is poised for substantial growth, and Sobha’s integrated model, encompassing backward integration for construction materials, ensures cost efficiency and quality control. With a strong pipeline of projects, a robust land acquisition strategy, and a reputation for excellence, Sobha Limited is well-placed to thrive in the competitive real estate landscape, delivering value to both its customers and stakeholders.
Business Segments
Sobha Limited operates across three primary business segments, leveraging its unique vertically integrated model for operational efficiency and quality control:
Residential Real Estate: Sobha focuses heavily on residential developments, particularly luxury and premium housing. In FY25, the company achieved notable sales in key regions, including its best-ever performance in Kerala and strong contributions from Bangalore. Sobha has been strategically launching new projects, with 0.48 million square feet of saleable area introduced in Bangalore during Q2 FY25, showcasing its ability to adapt to market demand for luxury homes.
Contractual and Manufacturing Services: Sobha provides construction and interior solutions through this segment, supporting its real estate projects and third-party clients. The company’s in-house capabilities include manufacturing products such as doors, windows, and metal works, ensuring consistent quality and reducing dependency on external vendors.
Commercial Real Estate and Other Ventures: Sobha is also active in commercial real estate, though this contributes less to its revenue compared to the residential segment. It supports businesses seeking office spaces and other facilities.
Key Subsidiaries and Their Information
Sobha Limited, one of India’s leading real estate developers, operates through a network of wholly owned subsidiaries and joint ventures. These entities manage specific aspects of its real estate, construction, and contractual businesses, enabling Sobha to streamline operations and maintain a competitive edge.
Key Subsidiaries and Step-down Subsidiaries
Sobha Developers (Pune) Limited: A wholly owned subsidiary that focuses on developing residential and commercial projects in Pune, a high-growth urban market in India.
Kilai Builders Private Limited: A step-down subsidiary that manages specific real estate projects or land parcels, particularly in regions where Sobha has an established presence.
Sobha Interiors Private Limited: This subsidiary supports Sobha’s construction projects by manufacturing high-quality interior fit-outs, enabling backward integration. It ensures cost control and quality consistency for residential and contractual developments.
Sobha Contracting Private Limited: Handles Sobha’s external construction contracts, including residential, commercial, and industrial projects, contributing to a diversified revenue stream outside the company’s core real estate business.
Sobha City Partnership Firm: Focuses on developing large-scale residential projects like Sobha City, which are aimed at providing luxury living in urban centres. The partnership model allows flexibility in operations.
Sobha Nandambakkam Developers Limited & Sobha Tambaram Developers Limited: These subsidiaries manage projects in Tamil Nadu, specifically targeting the markets of Nandambakkam and Tambaram in Chennai, focusing on residential and mixed-use developments.
Vayaloor Group of Companies (Multiple Entities): Includes Vayaloor Properties, Builders, Developers, Real Estate, and Realtors Private Limited, all step-down subsidiaries that manage various real estate and development activities across specific regions, especially in South India.
Sobha Highrise Ventures Private Limited: Focuses on high-rise residential developments in key urban markets like Bangalore and Hyderabad, catering to the demand for luxury vertical housing.
Sobha Construction Products Private Limited: Engaged in manufacturing construction materials like precast concrete, ensuring cost efficiency and quality in Sobha’s projects.
CVS Tech Park Private Limited (Associate): Sobha holds a 49% stake in this entity, which focuses on IT park development, leveraging the growing demand for commercial spaces in urban hubs.
Kondhwa Projects LLP (Joint Venture): A 50% partnership focused on executing specialized residential or commercial projects in strategic locations.
Significance of Sobha’s Subsidiaries
Subsidiaries like Sobha Interiors and Sobha Construction Products ensure control over supply chains, reducing dependence on third-party vendors.
Entities like Vayaloor and Kilai Builders allow Sobha to penetrate different geographic markets while mitigating risks. Contractual projects and manufacturing units provide income stability and resilience against market fluctuations in the real estate sector. Each subsidiary handles specific projects or aspects of the business, enabling greater operational efficiency and specialization.
Q2 FY25 Highlights
In H1-FY25, Sobha Limited recorded a total revenue of ₹1,635 crore, with a substantial 76.8% of this coming from its Real Estate business (₹1,256 crore). The remaining 19.4% was contributed by its Contractual & Manufacturing operations (₹317 crore). During this period, the company successfully delivered 871 units, covering 15.92 lakh sq. ft. of saleable area. This performance was accompanied by an EBITDA of ₹194 crore, resulting in an EBITDA margin of 11.9%, demonstrating healthy operational efficiency. In terms of profitability, PBT (Profit Before Tax) stood at ₹47.3 crore, while PAT (Profit After Tax) was ₹29.9 crore. Additionally, revenue from contracting activities grew marginally by 0.3% year-on-year to ₹164 crore, further contributing to the financial performance.
In Q2-FY25, Sobha achieved total revenue of ₹965 crore, with 80.9% from the Real Estate segment and 15.8% from Contractual & Manufacturing. The company recorded significant improvements in unit handovers, delivering 579 units (10.56 lakh sq. ft.), a remarkable 57.4% increase compared to the previous quarter. This surge in handovers was a key factor in driving profitability, with EBITDA of ₹108 crore and an EBITDA margin of 11.3%. PBT reached ₹36.2 crore, and PAT surged by 73.3% YoY to ₹26.1 crore, reflecting improved operational efficiencies and higher sales volumes. Revenue from contractual activities was ₹73 crore.
In terms of sales performance, Sobha had a strong showing in H1-FY25, selling 1,026 homes across 21.05 lakh sq. ft., generating ₹3,052 crore in revenue. The average realization per square foot was ₹14,498, a 32.7% increase compared to FY24, largely driven by strategic luxury project launches in Gurgaon and price hikes across ongoing projects. Regionally, Bangalore contributed 40.5% and NCR30.4% of total sales value, while Kerala accounted for 19%, experiencing a 17.4% YoY growth. Notably, Tamil Nadu showed a remarkable recovery, with sales doubling compared to the previous quarter and growing 107.6% YoY. In Q2-FY25, Sobha sold 464 homes (9.29 lakh sq. ft.), generating ₹1,179 crore at an average realization of ₹12,674 per sq. ft. Kerala achieved its best quarterly sales of ₹338 crore, while Hyderabad saw an impressive 98.7% increase in sales value QoQ.
From an operational perspective, Sobha completed 17.9 lakh sq. ft. of construction in H1-FY25, translating into 1,127 homes, a 7.9% YoY increase. In Q2-FY25 alone, the company completed 8.7 lakh sq. ft. (563 homes). These figures contribute to the growing recognized revenue, which stood at ₹14,477 crore as of September 30, 2024, ensuring continued revenue realization from completed sales.
Overall, Sobha Limited’s performance highlights a robust real estate business, which remains the dominant revenue driver, supported by strong sales growth and rising average realizations, particularly in luxury housing. The company’s ability to manage a strong project pipeline and deliver on key markets like Gurgaon, Bangalore, NCR, Kerala, and Tamil Nadu positions it well for sustainable growth in the coming quarters. With a balanced regional performance, Sobha continues to strengthen its position in the Indian real estate market, especially in the high-demand sectors of premium and luxury housing.
Financial Summary
INR in Cr.
Q2FY25
Q1FY5
Q2FY24
Q-o-Q (%)
Y-o-Y (%)
Real Estate Revenue
781.4
475.1
543.6
64.5%
43.7%
Contractual & Manufacturing Revenue
152.2
165.3
197.6
-7.9%
-23.0%
Other Income
31.7
29.5
32.4
7.5%
-2.2%
Total Income
965.3
669.9
773.6
44.1%
24.8%
Total Expenditure
856.5
584.5
665.8
46.5%
28.6%
EBIDTA
108.8
85.4
107.8
27.4%
0.9%
Depreciation
23.2
20.4
19.3
13.7%
20.2%
Finance Expenses
49.4
53.9
63.9
-8.3%
-22.7%
Profit Before Tax
36.2
11.1
24.7
226.1%
46.6%
PBT Margin
3.80%
1.70%
3.20%
123.5%
18.8%
Tax Expenses
10.10
5.00
9.70
102.0%
4.1%
PAT
26.10
6.10
14.90
327.9%
75.2%
PAT Margin
2.70%
0.90%
1.90%
200.0%
42.1%
Net Profit (after OCI)
23.50
6.40
13.10
267.2%
79.4%
PAT after OCI
2.40%
1.00%
1.70%
140.0%
41.2%
SWOT Analysis
Strengths
Strong Brand Equity: Recognized as a trusted name in the real estate industry.
Diversified Portfolio: A well-balanced mix of residential, commercial, and contractual projects.
Integrated Business Model: Seamless operations from development to construction ensure quality and cost control.
Expansive Land Bank: Strategic landholdings provide a competitive edge for future projects.
Focus on Luxury and Premium Housing: Catering to high-value clientele with quality-driven offerings.
Weaknesses
High Debt Levels: Increased financial liabilities can strain cash flow and profitability.
Regional Concentration: Heavy reliance on specific markets limits geographic diversification.
Project Execution Risks: Delays or cost overruns can impact customer trust and financial performance.
Dependency on Real Estate Sector: Vulnerability to industry-specific fluctuations and downturns.
Waaree Energies Ltd. is a prominent player in the renewable energy sector and one of India’s largest manufacturers of solar PV modules. Established in 1989, Waaree Energies has built a strong presence in the solar energy value chain, encompassing manufacturing, project development, and EPC (Engineering, Procurement, and Construction) services. Waaree operates state-of-the-art solar PV module manufacturing facilities with a total installed capacity of 12 GW, making it one of the largest in India. Waaree has developed and commissioned over 600 MW of solar power projects and has a pipeline of projects across multiple geographies. In FY23, Waaree Energies achieved a revenue of approximately ₹4,000 crores, demonstrating consistent growth driven by its diversified business segments.
Industry Outlook
The Indian solar sector is projected to grow at a CAGR of 15-20% between 2023 and 2030. The solar energy industry in India is at a transformative stage, driven by the government’s ambitious renewable energy targets, favourable policies, and increasing private sector participation. As of 2024, India has achieved over 80 GW of installed solar capacity, making it one of the largest solar markets globally. The country aims to achieve 280 GW of solar capacity by 2030, as part of its broader target of 500 GW from non-fossil fuel sources. The PLI (Production Linked Incentive) Scheme for solar module manufacturing provides financial incentives to enhance domestic production and reduce import dependency, particularly on China. Initiatives like Green Hydrogen Mission and solar-based hybrid projects are creating new opportunities in the solar sector. India is targeting 40 GW of domestic manufacturing capacityby 2026 under the PLI scheme.
Financial Summary
INR Cr.
Q1 FY25
Q2 FY25
FY23
FY24
Revenue
3409
3574
6751
11398
EBITDA
552
525
836
1575
OPM
16%
15%
12%
14%
PBT
531
499
677
1734
Net Profit
401
376
500
1274
NPM
11.7%
10.5%
7.41%
11.2%
EPS
19.99
13.73
24.49
62.72
C&CE
3698
3813
1736
3779
Business Segments:
Solar PV Modules: Waaree Energies is the largest solar module manufacturer in India, with a 12 GW annual production capacity spread across multiple manufacturing facilities. It produces high-efficiency photovoltaic (PV) modules, including monocrystalline, polycrystalline, bifacial, and PERC (Passivized Emitter and Rear Cell) technologies.
Power Generation: In Power Generation business segment focuses on producing electricity from diverse sources, including renewable and conventional energy.
EPC Contracts: Provides turnkey solar solutions for utility-scale and rooftop projects. Waaree has successfully executed over 1 GW of EPC projects, including utility-scale solar farms and rooftop installations. End-to-end project management, from design and procurement to construction and commissioning.
Subsidiary Information:
Waaree Clean Energy Solutions Private Limited: WCESPL is currently engaged in the business of generating, trading, purchasing, marketing, selling, importing, exporting, producing, manufacturing, transmitting, distributing, supplying, exchanging, or otherwise dealing in all aspects of thermal, hydro, nuclear, solar, wind power and power generated through non-conventional / renewable energy sources.
Waaree Power Pvt Ltd: WPPL is currently engaged in the business of carrying out the business of generating, trading, purchasing, marketing, selling, importing, exporting, producing, manufacturing, transmitting, distributing, supplying, exchanging or otherwise dealing in all aspects of thermal, hydro, nuclear, solar, wind power and power generated through non-conventional / renewable energy sources.
Waaneep Power Pvt Ltd:WSPL One is currently engaged in the business of generating, trading, purchasing, marketing, selling, importing, exporting, producing, manufacturing, transmitting, distributing, supplying, exchanging, or otherwise dealing in all aspects of thermal, hydro, nuclear, solar, wind power and power generated through non-conventional / renewable energy sources.
Sangam Solar One Power Pvt Ltd: SSPL One is currently engaged in the business of generating, trading, purchasing, marketing, selling, importing, exporting, producing, manufacturing, transmitting, distributing, supplying, exchanging, or otherwise dealing in all aspects of thermal, hydro, nuclear, solar, wind power and power generated through non-conventional / renewable energy sources.
Waaree Renewables Technologies Ltd: WRTL is currently engaged in the business of generating, trading, purchasing, marketing, selling, importing, exporting, producing, transmitting, distributing, supplying, exchanging or otherwise dealing in all aspects of thermal, hydro, nuclear, solar, wind power and power generated through non-conventional / renewal energy sources.
Q2 FY25 & Business Highlights
Revenue of ₹3574 crore in Q2 FY25 down by 1.05% YoY from ₹3105 crore in Q2 FY24.
EBITDA of ₹525 crore in this quarter at a margin of 15% compared to 14% in Q2 FY24.
Profit of ₹376 crore in this quarter compared to a ₹321 crore profit in Q2 FY24.
Capex of 5.4GW Cell Mfg. expected to be operational by FY25, 1.6GW Module Mfg. in USA expected to be operational by FY25.
The current order book for the Company stands at approx. 20GW, and presently has 13.3 GW capacities. It has 5.4 GW Cell Manufacturing Facility at Chikli, 6 GW integrated facility at Odisha. And it has production volume of 3.3GW.
The Solar and Batteries cost has been declined by almost 80% from 2012 till now.
The order book as per geography is 27.5% domestic and 72.5% overseas. And till now, Pan India it has total 372 franchisees.
SWOT Analysis
Strengths:
Market Leadership: A dominant position in the industry ensures competitive advantage and strong market share.
Technological Edge: Advanced technologies provide an edge over competitors and drive innovation.
Strong Brand Presence: A well-established brand fosters customer trust and loyalty.
Policy Support: Favorable government policies and incentives promote growth and stability.
Weaknesses:
High Dependency on Imports: Reliance on imported components increases vulnerability to supply chain disruptions.
Limited Product Diversification: A narrow product portfolio limits the ability to tap into diverse customer needs.
Capital-Intensive Operations: High operational costs can strain resources and profitability.
Intense Competition: Fierce market competition pressures pricing and margins.
Opportunities:
Rising Solar Demand: Increasing adoption of renewable energy drives growth potential.
Energy Storage Solutions: Expanding into storage technology complements solar offerings.
Global Expansion: Entering international markets opens new revenue streams.
Backward Integration: Controlling supply chains enhances efficiency and cost management.
Threats:
Regulatory and Policy Risks: Changes in regulations or government policies can impact operations.
Price Volatility: Fluctuations in raw material costs affect pricing and profitability.
Global Trade Wars: Tariffs and trade restrictions disrupt supply chains and market access.
Economic Uncertainty: Economic slowdowns or instability could hinder growth prospects.
Swan Energy Ltd. (SEL), formerly known as Swan Mills Limited, was established on February 22, 1909, and underwent a major transformation in 1992 when it was acquired by the Dave and Merchant families from the J.P. Goenka Group. Today, SEL operates across three core verticals: Textiles, Energy, and Construction & Real Estate, marking its presence in sectors critical to India’s economic growth. During the 1990s, SEL faced financial challenges and was brought under the Board for Industrial and Financial Reconstruction (BIFR). The revival plan focused on reviving its spinning unit, disposing of surplus land for modernization, and resuming operations. By 1993-94, SEL achieved profitability, and in 1995, BIFR declared it financially sound. Initially, its Textile Division relied on job work operations, accounting for 80% of mill processing, and expanded into exports, supplying to Marks & Spencer, a leading European retailer.
In the Energy Sector, SEL made significant advancements with the development of India’s first Greenfield LNG Port Terminal at Jafrabad, Gujarat, through its subsidiaries Swan LNG Private Ltd. (SLPL) and Triumph Offshore Private Ltd. (TOPL). The 10 MMTPA terminal, operational since FY 2021, utilizes the Floating Storage and Regasification Unit (FSRU) ‘Vasant 1’, deployed in 2020. SEL secured long-term agreements with IOC, BPCL, ONGC, and GSPC for terminal utilization and collaborated with Mitsui OSK Lines (MOL) of Japan to enhance LNG operations. Additionally, SEL signed charter hire agreements with companies in Hong Kong and Ghana, showcasing its growing international presence in LNG. In Real Estate, SEL has strategically invested in high-value assets. In FY 2014, it acquired a 0.3 million sq. ft. IT Park in Whitefield, Bangalore, leased to MNCs. It also developed Technoya Park in Hyderabad, leasing 2.92 lakh sq. ft. to Mahataa Information India Pvt. Ltd., generating an annual rent of ₹14 crore, which was utilized to service loans. SEL has also executed significant projects, such as a ₹459 crore LNG terminal infrastructure agreement with Black & Veatch Private Limited in 2018. With a focus on infrastructure development, sustainability, and sectoral diversification, SEL has positioned itself as a key player in India’s growth and development initiatives.
Industry Outlook
Swan Energy operates in three key sectors—Energy (LNG Infrastructure), Textiles, and Real Estate—all of which are poised for significant growth. The LNG infrastructure industry, where Swan Energy is a key player, is projected to grow at a CAGR of 8-10% globally through FY25, driven by the increasing adoption of natural gas as a cleaner fuel and rising investments in Floating Storage and Regasification Units (FSRUs). In India, the LNG sector is expected to expand at a CAGR of 11-13%, supported by the government’s initiatives to enhance natural gas’s share in the energy mix from 6% to 15% by 2030, aligning with its net-zero emission goals. Swan Energy’s Jafrabad Greenfield LNG Terminal positions it to capitalize on this growth, particularly as demand for imported LNG rises due to domestic production shortfalls.
The real estate sector in India is experiencing robust recovery, with a projected CAGR of 8-9% until FY30, fueled by urbanization, increasing demand for commercial spaces, and government initiatives like Smart Cities Mission. Swan Energy’s investments in high-value IT parks and commercial properties, such as Technoya Park in Hyderabad and its Bangalore IT Park, place it in a strong position to benefit from this trend.
In the textile sector, where Swan Energy has historical roots, the Indian textile industry is expected to grow at a CAGR of 10-12% by FY25, driven by rising exports, increased consumer spending, and growing demand for sustainable fabrics. Despite Swan Energy’s reduced focus on textiles, its legacy operations provide stability and diversification.
Overall, with strong tailwinds in the LNG, real estate, and textile sectors, Swan Energy is well-positioned for sustained growth. The company’s investments in infrastructure, clean energy solutions, and high-value real estate assets align with India’s long-term economic and sustainability goals, making it a potential leader in its operating segments.
Business Segments
Swan Energy operates through a diverse range of business segments, each contributing uniquely to its overall revenue and strategic vision.
The Textile Segment forms the company’s historical foundation, focusing on the processing and manufacturing of fabrics. This segment thrives on job work operations, serving long-standing clients and generating stable revenues. Additionally, it has supported export initiatives, previously catering to high-profile clients like Marks & Spencer.
The Energy Segment represents Swan Energy’s flagship business, driving its growth in India’s clean energy transition. This segment includes the operation of India’s first Greenfield LNG Port Terminal at Jafrabad, Gujarat, managed through subsidiaries Swan LNG Private Ltd. (SLPL) and Triumph Offshore Private Ltd. (TOPL). By utilizing Floating Storage and Regasification Units (FSRUs) and partnering with major companies like IOC, BPCL, and ONGC, the energy segment plays a vital role in providing LNG infrastructure and clean energy solutions.
In the Construction and Others Segment, Swan Energy focuses on infrastructure development and construction projects linked to its real estate and energy ventures. This segment is critical for executing large-scale industrial developments, such as the LNG port. The Distribution & Development Segment complements this by handling the distribution of resources like LNG and engaging in real estate development, aligning with India’s expanding infrastructure and urbanization needs.
The Warehousing Segment supports industries requiring logistical solutions through strategically located commercial warehousing facilities. These facilities generate consistent income by attracting corporate clients with long-term leasing agreements. The Manufacturing Segment encompasses Swan Energy’s legacy fabric manufacturing operations alongside other industrial production activities, which are bolstered by modernized facilities to remain competitive.
Lastly, the Power Generation Segment focuses on sustainable energy production, supporting the company’s operations while adhering to its commitment to clean and efficient energy solutions. Collectively, these diversified business segments enable Swan Energy to maintain a balanced revenue portfolio, mitigate risks, and align itself with India’s economic growth and sustainable development goals.
Key Subsidiaries and Their Information
Swan Energy Limited operates through several subsidiaries, each contributing uniquely to its diverse business portfolio across energy, real estate, and infrastructure sectors:
Cardinal Energy and Infrastructure Private Limited (Wholly Owned Subsidiary): It focuses on energy infrastructure projects that align with Swan Energy’s mission of driving clean energy adoption.
Pegasus Ventures Private Limited (Wholly Owned Subsidiary): It is engaged in investment activities and plays a strategic role in supporting Swan Energy’s financial and operational goals.
Swan LNG Private Limited (Subsidiary): A flagship subsidiary managing India’s first Greenfield LNG Port Terminal at Jafrabad, Gujarat. It specializes in Floating Storage and Regasification Unit (FSRU) operations and has partnered with major players like IOC, BPCL, and ONGC for capacity utilization.
Triumph Offshore Private Limited (Wholly Owned Subsidiary); It is the key player in the construction and operation of LNG infrastructure, including FSRUs. Collaborates with global entities such as Hyundai Heavy Industries for shipbuilding and Mitsui OSK Lines for project execution.
Swan Mills Private Limited (Wholly Owned Subsidiary): It represents the company’s textile operations and holds legacy value, contributing to Swan Energy’s roots in fabric manufacturing and processing.
Veritas (Hazel Infra Limited (Subsidiary)It specializes in real estate development and infrastructure projects, bolstering Swan Energy’s presence in commercial and residential properties.
Swan Imagination Private Limited (Wholly Owned Subsidiary): It operates in real estate and infrastructure management, focusing on leasing and development of commercial properties.
Wilson Corporation FZE (Foreign Wholly Owned Subsidiary): It’s a foreign subsidiary based in the UAE, playing a role in international ventures and investments, though currently non-operational.
These subsidiaries form the backbone of Swan Energy’s diversified operations, enabling it to excel in clean energy infrastructure, textiles, and real estate development, while strategically exploring global opportunities.
Q2 FY25 Highlights
Swan Energy’s Q2 FY25 consolidated results reveal a challenging quarter, marked by revenue and profitability pressures.
The total revenue for the quarter stood at ₹1,032.19 crore, a decline of 15.6% YoY compared to the same period last year. The net profit also dropped significantly by 59.4% YoY to ₹67.13 crore, impacted by higher expenses and operational challenges. This contrasts with the company’s robust year-over-year growth trend in recent fiscal periods, where Swan Energy reported substantial annual revenue growth
In Q2 FY25, Swan Energy’s revenue experienced declines across key segments:
Textile Segment: Revenue fell by 54.32% year-on-year to ₹25.41 crore.
Energy Segment: Witnessed a significant 65.13% decline, reaching ₹65.99 crore.
Construction Segment: Revenue dropped to ₹25.27 crore, down from ₹37.46 crore in Q2 FY24.
The company’s Energy segment, which includes its LNG operations, remains a core contributor to its performance. However, it faced headwinds due to market conditions and operational costs. The Textile segment contributed to stabilizing revenue streams but remains a smaller part of the overall business. The Real Estate segment, known for leasing high-value commercial properties, continued to provide recurring income
Management commentary during the results highlighted the focus on long-term growth through LNG infrastructure investments and real estate portfolio optimization. Despite the quarterly setback, Swan Energy emphasized its strategy of leveraging strategic partnerships and innovative solutions to strengthen its position in clean energy and real estate
Financial Summary
INR in Cr.
Q2FY25
Q1FY5
Q2FY24
Q-o-Q (%)
Y-o-Y (%)
Net Sales
1032.19
1141.74
1223.26
-9.6%
-15.6%
Other Income
31.32
19.82
6.85
58.0%
357.2%
Total Expenditure
940.45
788.36
993.4
19.3%
-5.3%
Operating Profits
217.08
453.34
322.15
-52.1%
-32.6%
Interest
65.66
52.63
58.34
24.8%
12.5%
PBT
57.4
320.57
178.37
-82.1%
-67.8%
Tax
-9.73
52.89
12.81
-81.6%
-24.0%
Net Profit
67.13
267.67
165.57
-74.9%
-59.5%
Adj EPS in Rs.
2.28
8.57
6.69
-73.4%
-65.9%
SWOT Analysis
Strengths:
Strong Outlook: A robust growth trajectory driven by key projects and market demand.
Pioneering LNG Infrastructure: Cutting-edge facilities, making the company a leader in LNG infrastructure development.
Strong Partnerships: Strategic alliances with key players strengthen market position and operational efficiency.
Diversified Business Portfolio: Operations span across LNG, real estate, and textiles, reducing dependency on a single sector.
Weaknesses:
Limited Presence in Core LNG Markets: The company’s reach in major global LNG markets remains constrained.
Dependence on Key Projects: Over-reliance on a few critical projects poses risks to revenue consistency.
Lower Focus on Textiles: Neglected growth in the textile segment affects overall business balance.
Regulatory and Environmental Challenges: Navigating stringent regulations impacts operations and costs.
Opportunities:
Rising Demand for LNG: Increasing global LNG consumption creates significant growth prospects.
Real Estate Expansion: Opportunities in the booming real estate sector add to revenue streams.
Government Initiatives: Supportive policies and incentives offer avenues for accelerated growth.
International Collaborations: Potential for partnerships with global players to expand market reach.
Threats:
Market Competition: Intense rivalry in the LNG and real estate sectors may impact profitability.
Economic Volatility: Fluctuations in global and domestic markets pose financial risks.
Environmental Regulations: Increasingly stringent standards could escalate compliance costs and operational hurdles.
Vardhman Holdings Limited (formerly known as Vardhman Spinning & General Mills Ltd) was incorporated in 1962 and began production in 1965. Promoted by V.S. Oswal and R.C. Oswal, it is part of the Vardhman Group, which includes notable entities like Mahavir Spinning Mills and Vardhman Polytex. Initially focused on textile manufacturing, the company has evolved into an entity engaged in lending and investing activities, with a significant presence in the capital markets.
In November 1992, the company raised Rs. 47.82 crore through a Rights Issue of 14% PCDs to fund expansion and meet long-term working capital needs. Historically, its portfolio included cotton and worsted blended yarn, cotton yarn, and fabric, serving both domestic and international markets such as the UK, Spain, Germany, Italy, Hong Kong, Indonesia, Japan, the US, and African countries. Vardhman became an Export House in 1990-91 and earned ISO 9002 certification for its textile mill, demonstrating its commitment to quality.
Key milestones include the sale of its steel unit in Faridabad to Mahavir Spinning Mills in 1995 and the commencement of Auro Textiles at Baddi, Himachal Pradesh, in 1999, in collaboration with Tokai Senko of Japan, achieving an annual capacity of 30 million meters. The company expanded further by commissioning a 100% EOU Spinning Unit in Ludhiana in 2002 and modernizing its dyeing unit at Baddi, enhancing capacity to 9 tons per day.
A pivotal transformation occurred in 2004-05 through a Scheme of Arrangement and Demerger, which transferred the textile business to Mahavir Spinning Mills Limited. The remaining assets comprised investments in group company shares, leading to its rebranding as Vardhman Holdings Limited in March 2006. Shareholders received 8 equity shares of Mahavir Spinning Mills and 2 equity shares of Vardhman Holdings for every 10 shares held. As of now, Vardhman Holdings operates primarily as an investment company, leveraging its robust financial history and strategic restructuring to deliver sustained growth and value creation.
Industry Outlook
Vardhman Holdings, as an investment and lending entity, is strongly tied to the financial health of its group companies in the textile sector and the overall investment landscape. The Indian financial and investment industry is expected to grow at a CAGR of 12-14% by FY25, supported by rising capital market participation, digitalization, and increasing institutional investments. Simultaneously, the textile industry, a core focus of Vardhman’s portfolio, is projected to grow at a CAGR of 10-12% by FY25, driven by global demand, government incentives like PLI, and a shift towards sustainable, value-added textiles. Vardhman Holdings’ low debt, efficient capital allocation, and strategic investments in high-growth segments like technical textiles and branded apparel position it well for long-term sustainable returns. Moreover, with India’s textile exports projected to contribute significantly to the industry’s target of $350 billion by FY30, Vardhman Holdings stands to benefit from portfolio diversification and growth in domestic and international markets, aligning with the broader trends in the financial and textile ecosystems.
Business Segments
Vardhman Holdings Limited (VHL) primarily operates in the investment and lending domain, managing its portfolio through two major segments:
Investment Activities: VHL’s core business involves managing its investments, primarily in group companies like Vardhman Textiles, Vardhman Polytex, and other entities in the Vardhman Group. These investments form a significant part of its asset base. The company’s strategy revolves around long-term capital appreciation through its stake in companies engaged in textiles, yarn production, and fabric manufacturing, sectors that are integral to India’s economy. Returns from these investments are a key contributor to the company’s profitability and stability, driven by dividends, interest income, and capital gains.
Lending Activities: VHL also engages in lending operations, providing short-term and long-term loans to group companies and external borrowers. The lending activities support the working capital requirements and expansion needs of its portfolio companies, ensuring smooth operations and growth. This segment generates interest income, offering a stable and predictable revenue stream to complement its investment returns.
Key Subsidiaries and Their Information
VHL has a strategic relationship with associate companies primarily within the Vardhman Group, which focus on various aspects of the textile and yarn manufacturing ecosystem. Below are the key entities and their contributions:
Vardhman Textiles Limited: It’s a flagship company of the Vardhman Group, it is one of India’s largest integrated textile manufacturers. Produces and exports cotton yarn, synthetic yarn, and woven fabrics for global and domestic markets. A major contributor to VHL’s investment portfolio, providing consistent dividend income and value appreciation.
Vardhman Spinning and General Mills Limited: Itspecializes in spinning high-quality cotton and blended yarns for the textile industry. Supplies yarns used in knitwear and woven fabrics, complementing the operations of Vardhman Textiles. Enhances VHL’s exposure to the upstream segment of the textile value chain.
Vardhman Special Steels Limited: It focuses on manufacturing specialty steel products for automotive, engineering, and industrial applications. Supplies critical steel components to automobile OEMs and precision engineering firms globally. Diversifies VHL’s portfolio beyond textiles, leveraging growth in the automotive and industrial sectors.
Vardhman Acrylics Limited: It is engaged in manufacturing acrylic fiber and blends used in textiles, home furnishings, and industrial fabrics. Supplies high-performance fibers with applications in winter clothing and upholstery fabrics. Strengthens VHL’s footprint in specialized textile segments with growth potential.
Vardhman Polytex Limited: It manufactures yarns and fabrics and caters to domestic and export markets. Produces a variety of yarns used in textiles, such as blended, dyed, and grey yarns. A niche player that supports the group’s vertical integration strategy within textiles.
These subsidiaries and associates form a diversified portfolio for VHL, allowing it to capitalize on the growth potential of the textile and specialty material industries while maintaining a low-risk, steady-income approach.
Q2 FY25 Highlights
In the quarter ended September 2024, Vardhman Holdings reported a net profit decline of 20.26% YoY, standing at ₹49.38 crore, compared to ₹61.93 crore in September 2023. The company experienced a significant sales decline of 75.55% YoY, with revenue dropping to ₹7.40 crore from ₹30.27 crore in the same quarter last year.
The Operating Profit Margin (OPM) contracted sharply, falling from an exceptionally high 97.56% in September 2023 to 65.95% in the current quarter. Similarly, Profit Before Depreciation and Taxes (PBDT) and Profit Before Tax (PBT) both declined by 10% YoY, from ₹68.87 crore to ₹62.09 crore.
Key Takeaways:
Sales Drop: The sharp decline in sales reflects weaker performance in core revenue-generating activities.
Profit Resilience: Despite reduced revenue, profitability remains relatively strong, supported by efficient cost management and investment returns.
Margin Compression: The decrease in OPM indicates lower operating efficiency or one-off impacts during the quarter.
Overall, while investment income has helped sustain profits, the significant sales decline underscores potential challenges in operational performance or market dynamics, requiring close monitoring of upcoming quarters.
Financial Summary
INR in Cr.
Q2FY25
Q1FY25
Q2FY24
Q-o-Q (%)
Y-o-Y (%)
Total Income
7.4
6.6
30.27
12.1%
-75.6%
Operating Expenses
2.52
1.28
0.74
96.9%
240.5%
Operating profit
4.88
5.32
29.53
-8.3%
-83.5%
Other Income
0.48
0.44
0.51
9.1%
-5.9%
PBT
62.09
74.4
68.87
-16.5%
-9.8%
Tax
12.71
1.27
6.94
900.8%
83.1%
Net Profit
49.38
73.13
61.93
-32.5%
-20.3%
Basic EPS (Rs.)
154.73
229.24
194.03
-32.5%
-20.3%
SWOT Analysis
Strengths:
Backed by a Strong Parent Group, ensuring stability and trust.
A Diversified and Robust Investment Portfolio offering steady returns.
Maintains a debt-free status, enhancing financial resilience.
Strategic alliances that provide growth opportunities and market access.