Tata Motors Q2 Results Live: Profit Declines 11.18% Year-on-Year
Company Overview
Established in 1945 as Tata Engineering and Locomotive Co. Ltd, Tata Motors began as a locomotive manufacturer, unveiling its first steam road roller in 1948 and introducing medium commercial vehicles in collaboration with Daimler Benz by 1954. The company expanded rapidly, launching India’s first indigenous passenger car, the Tata Sierra, and diversifying into both light and heavy commercial vehicles. Tata Motors has built a strong global presence through key acquisitions, including South Korea’s Daewoo Commercial Vehicle in 2004 and Jaguar Land Rover (JLR) in 2008, marking its entry into the luxury market. Supported by research and design centers in India, the UK, Italy, and Korea, Tata Motors markets vehicles across Europe, Africa, South Asia, and Australia. Domestically, Tata Motors leads in the commercial vehicle market and holds a significant share in passenger vehicles, with products ranging from sub-1-ton trucks to 49-ton heavy-duty models, manufactured in multiple plants across India. Known for innovation, the company launched the Tata Nano, among the world’s most affordable cars, solidifying its reputation for durable and cost-effective vehicles.
Between 2017 and 2023, Tata Motors pioneered India’s electric vehicle (EV) market with the Tigor EV, later expanding its EV lineup with models like the Tiago EV and Tata Ace EV, the country’s first electric mini-truck. The launch of Tata Passenger Electric Mobility Limited (TPEML) in FY 2022-23, supported by a Rs. 7,500 crore investment from TPG Rise Climate, emphasized Tata’s commitment to an EV ecosystem. Product expansions included the new Safari and Punch (India’s first sub-compact SUV) in passenger vehicles, along with CNG variants of the Tiago and Tigor. In commercial vehicles, Tata Motors introduced India’s first CNG-powered Medium & Heavy Commercial Vehicle (M&HCV) and specialized models like the Yodha 2.0 and Intra series, catering to agriculture, logistics, and e-commerce sectors. Tata Motors also enhanced customer support by introducing a 6-year warranty on M&HCV trucks in 2018 and launched Tata Motors Genuine Oil to optimize commercial vehicle performance.
The company’s international reach has been bolstered by JLR subsidiaries in Europe, North America, and Asia, alongside strategic acquisitions like Spark44 Taiwan and Brabo Robotics, aligning with advanced automation and electric mobility. With investments of Rs. 36,636 Crores in FY 2019 and Rs. 31,222 Crores in FY 2020 for R&D and expansion, Tata Motors remains committed to sustainable, advanced automotive solutions. Today, it stands as a dynamic leader in the global automotive industry, propelling India’s mobility sector through innovation, sustainability, and quality vehicles that address diverse market needs.
Industry Outlook
The automobile industry in FY25 and beyond is poised for significant growth, largely driven by the shift to electric vehicles (EVs), a surge in demand for SUVs, and continued growth in commercial vehicles (CVs). The transition to EVs is central to the industry’s future, supported by sustainability goals, regulatory incentives, and advancements in EV technology. Government support through tax incentives, subsidies, and charging infrastructure is expected to accelerate the adoption of EVs globally, with India benefiting from initiatives like the FAME II scheme. Tata Motors, already a leader in India’s EV market, is well-positioned to capitalize on this shift.
Meanwhile, the SUV segment is expected to maintain robust growth, with an anticipated 8% year-on-year increase in demand as consumers continue to prefer larger, more versatile vehicles. Tata Motors’ emphasis on popular SUVs like the Safari and Punch is well-aligned with this trend. Similarly, the commercial vehicle segment—especially in medium and heavy commercial vehicles (M&HCVs)—will continue to thrive, driven by growth in sectors such as logistics, e-commerce, and construction, where Tata Motors maintains a strong presence. The company is also tapping into new opportunities with CNG-powered M&HCVs, ensuring its leadership in this sector.
The recovery of global supply chains, which were disrupted by the pandemic and geopolitical tensions, is another key factor in the industry’s future growth. Challenges like semiconductor shortages and raw material price hikes continue to affect production, but supply chain resilience is improving. This will enable Tata Motors to ramp up production in FY25 and meet the increasing demand, especially as the luxury vehicle market continues to grow. However, the company faces challenges in key markets like China, which has impacted Jaguar Land Rover (JLR)‘s performance.
Tata Motors has strategically positioned itself as a leader in both the passenger and commercial vehicle segments, while also leading the EV revolution in India. The company has invested heavily in Tata Passenger Electric Mobility Limited (TPEML), which recently secured a ₹7,500 crore investment from TPG Rise Climate. This positions Tata Motors to take full advantage of the EV sector’s growth potential, even as subsidy phases out over time.
In the luxury vehicle space, JLR, while facing challenges such as supply chain disruptions and a slowing Chinese market, continues to focus on high-performance and premium electric models. The company’s outlook remains positive, with an £30 billion revenue target and an EBIT margin of over 8.5%. JLR is also prioritizing its “House of Brands” strategy, which will elevate its luxury image and increase demand for its halo products.
Tata Motors’ global expansion via acquisitions like Jaguar Land Rover has strengthened its presence across Europe, North America, Asia, and Africa. However, the company remains mindful of ongoing supply chain challenges, including disruptions such as flooding at the Nivelles facility. Despite these challenges, Tata Motors is focused on building supply chain resilience to adapt to the evolving global market.
The broader automobile sector is recovering as consumer confidence returns post-pandemic. In both developed and emerging markets like India, vehicle demand is expected to rise, with the festive season traditionally boosting retail sales. Government policies and incentives will continue to drive the demand for sustainable mobility, particularly for energy-efficient vehicles, providing Tata Motors with an ideal environment for growth in FY25 and beyond.
Looking ahead, Tata Motors is focusing on consistent, cash-generating growth across its segments. In the commercial vehicle (CV) segment, Tata Motors aims to increase market share and improve realizations by focusing on innovation, service quality, and brand activation. In the passenger vehicle (PV) segment, the company will drive retail growth with new model launches, strengthen its dealer network, and focus on cost reduction to improve profitability in a competitive environment. For EVs, Tata will continue to mainstream EV adoption through targeted market development and ecosystem support, ensuring scalable profitability. The company’s goal is to enhance its position as a leader in the growing EV market and ultimately become net debt-free.
Business Segments
Tata Motors operates in several core business segments:
- Passenger Vehicles (PV): The Passenger Vehicles (PV) segment at Tata Motors includes various passenger cars and utility vehicles, with a strong presence in India’s electric vehicle (EV) market, driven by models like the Nexon EV. Tata PV reported revenue of ₹11,700 crores in Q2 FY25, showing a 3.9% YoY decline, and ₹23,500 crores in H1 FY25, down 5.9% YoY. EBITDA margin for Q2 was at 6.2%, with the ICE segment at 8.5%, while the EV business posted a negative EBITDA but turned positive when excluding development expenses. Tata leads the EV market with a 67% share, supported by new launches like the Curvv and Nexon variants. Moving forward, Tata PV aims to drive retail growth with new model launches, inventory management, and a multi-powertrain strategy to stay competitive in this dynamic market.
- Commercial Vehicles (CV): Tata Motors is a leading player in India’s commercial vehicle (CV) market, manufacturing a diverse lineup of trucks, buses, and light commercial vehicles that serve sectors such as logistics, mining, and construction. In Q2 FY25, the CV segment recorded revenue of ₹17,300 crores, marking a 13.9% YoY decline; for H1 FY25, revenue totalled ₹35,100 crores, down 5.2% YoY. Profitability improved slightly, with an EBITDA margin of 10.8% and a PBT of ₹1,300 crores. However, CV volumes dropped by 19.6% to 79,800 units, impacted by slower infrastructure project execution, reduced mining activity, and heavy rains. Growth in specific sub-segments, such as EV buses and ACE EV vehicles, along with orders from government entities, is expected to support a demand recovery. Tata Motors projects a gradual demand increase in H2 FY25, driven by infrastructure investments and festive season consumption.
- Jaguar Land Rover (JLR): Jaguar Land Rover (JLR), acquired by Tata Motors in 2008, forms the luxury vehicle segment of the company with its renowned Jaguar and Land Rover brands. Aligning with sustainable mobility trends, JLR is actively expanding its EV and hybrid vehicle offerings. The segment reported revenue of approximately ₹65,000 crores in Q2 FY25, a 5.6% YoY decline. H1 FY25 revenue remained stable at around ₹1,37,000 crores. Profitability faced challenges this quarter, as EBITDA margin dropped to 11.7% (a decrease of 320 basis points), and EBIT stood at 5.1% (down by 220 basis points). Q2 PBT was approximately ₹3,980 crores, while H1 PBT grew 25% YoY, reaching around ₹10,910 crores. Temporary factors, including an aluminium supply shortage and quality checks on over 6,000 vehicles, impacted overall performance. However, production is expected to rebound in H2 FY25. Significant EV production investments have generated high interest, particularly in the new Range Rover Electric and upcoming Jaguar EV models. On the financial side, JLR maintained a liquidity position of ₹49,000 crores, including a recently refinanced revolving credit facility of ₹16,000 crores. These investments and liquidity measures are expected to support JLR’s continued innovation and growth in sustainable luxury vehicles.
- Electric Mobility: As part of its sustainable strategy, Tata Motors is actively developing electric vehicle solutions across passenger and commercial segments. The company aims to expand EV adoption in India through its dedicated EV division, Tata Passenger Electric Mobility Limited.
- Tata Motors Finance (TMF): Tata Motors Finance is the financial services arm of Tata Motors, offering vehicle financing and insurance services, mainly to support its PV and CV segments.
These segments collectively support Tata Motors’ mission to provide a range of mobility solutions and remain competitive in both domestic and international markets.
Key Subsidiaries and Their Information
Tata Motors’ key subsidiaries are driving growth and innovation across various automotive segments. Below are some of the key subsidiaries and their info:
- Jaguar Land Rover (JLR): This luxury automotive subsidiary continues to lead Tata Motors’ global presence. JLR has seen strong revenue performance, especially in the North American and European markets. They are focusing on electric vehicles (EVs) with a mix of high-end offerings like the Range Rover and Defender, helping drive up retail and wholesale volumes. JLR also continues to improve profitability and reduce net debt.
- Tata Passenger Electric Mobility Ltd (TPEML): Tata’s EV subsidiary is pivotal to its strategy for growth in the electric vehicle sector. With significant investment from TPG Rise Climate, TPEML is positioned to capture the growing demand for electric cars in India. The company’s EV portfolio includes models like the Tigor EV, Tiago EV, and Ace EV.
- Tata Commercial Vehicles (CV): This arm focuses on strengthening Tata Motors’ leadership in the commercial vehicle market, especially in medium and heavy trucks. With innovations in CNG-powered vehicles and a strong presence in sectors like logistics and e-commerce, Tata CV is well-positioned to benefit from India’s infrastructure development.
- Tata Technologies Ltd: A global leader in engineering and design services, Tata Technologies supports Tata Motors with advanced technologies and innovation, particularly in the development of electric vehicles and enhancing product offerings
Tata Motors’ key subsidiaries play a crucial role in driving the company’s strategy, focusing on growth in electric mobility, enhancing its luxury brands, and expanding its commercial vehicle sector. Tata Motors also strengthens its presence in key global markets like Europe, North America, and Africa through joint ventures and strategic partnerships. These efforts are aligned with Tata Motors’ broader strategy to lead in electric mobility, luxury vehicles, and the commercial vehicle market
Q2 FY25 Highlights
- Tata Motors (TML) delivered a revenue of ₹101,500 crores for Q2 FY25, which marks a 3.5% decline YoY. The EBITDA was ₹11,600 crores, translating to a margin of 11.4%, which is a 230 basis points (bps) decrease compared to the previous year. EBIT was reported at ₹5,600 crores (5.6% margin), a 190 bps decrease YoY.
- The PBT (before exceptional items) for Q2 stood at ₹5,800 crores, down ₹391 crores, and the net profit for the quarter was ₹3,500 crores. However, the company posted a strong performance in H1 FY25, with a PBT (bei) of ₹14,600 crores, reflecting an improvement of ₹2,900 crores compared to the previous year.
- For Jaguar Land Rover (JLR), the revenue was down 5.6% YoY to £6.5 billion (approximately ₹62,500 crores based on current exchange rates). JLR’s performance was impacted by temporary supply constraints, resulting in a 220 bps drop in EBIT margin to 5.1%.
- Tata Motors’ Commercial Vehicle (CV) revenues declined by 13.9%, but the EBITDA margin improved to 10.8% (up 40 bps) due to favorable pricing and material cost savings.
- The Passenger Vehicle (PV) segment experienced a 3.9% revenue decline, but the EBITDA margin remained steady at 6.2% (down 30 bps) thanks to mix improvements and cost reduction efforts.
- The company introduced the Nexon ICNG and 45 kWh models, which have received strong market reception. A groundbreaking ceremony for a new plant in Chennai highlights Tata’s ongoing commitment to expanding production capabilities.
- The company is advancing toward its decarbonization roadmap, targeting net carbon zero by 2039 and ensuring a BEV derivative for all its brands by 2030.
- Tata Motors maintains its leadership in the electric vehicle (EV) segment, with a dominant 67% market share in the personal EV segment.
- Tata Motors Ltd. faced a challenging quarter, with a 3.5% decline in revenue, largely driven by supply chain disruptions and reduced demand across segments. The company also experienced challenges in its Jaguar Land Rover (JLR) division, where a flood at a key supplier led to production constraints, affecting the production of 86,000 units. Additionally, EBIT margins were impacted due to higher DNA charges and increased sales support expenses.
- In the Chinese market, industry-wide discounting and overstocking created difficulties for Tata Motors, resulting in strained dealer networks and reduced sales.
- The company’s commercial vehicle (CV) volumes declined by 19% year-on-year, influenced by external factors such as higher interest rates and reduced mining activities, which slowed demand for heavy vehicles.
Financial Summary
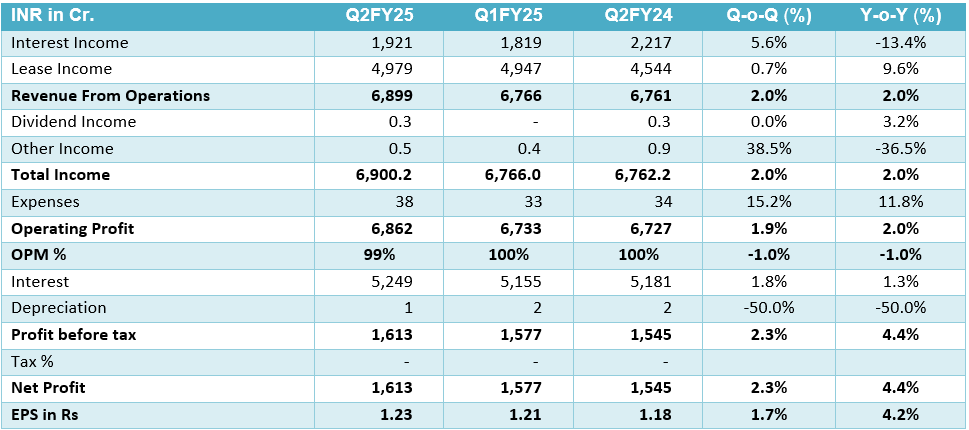
| INR in Cr. | Q2FY25 | Q1FY25 | Q2FY24 | Q-o-Q(%) | Y-o-Y(%) |
| Revenue from Operations | 1,01,450 | 1,08,048 | 1,05,129 | -6.1% | -3.5% |
| Other Income | 1,566 | 1,575 | 1,630 | -0.6% | -3.9% |
| Total Income | 1,03,016 | 1,09,623 | 1,06,759 | -6.0% | -3.5% |
| Expenses | 89,291 | 92,263 | 91,362 | -3.2% | -2.3% |
| Operating Profit | 12,159 | 15,785 | 13,767 | -23.0% | -11.7% |
| OPM (%) | 12% | 15% | 13% | -20.0% | -7.7% |
| Finance Cost | 2,034 | 2,088 | 2,652 | -2.6% | -23.3% |
| Depreciation and Amortisation Expenses | 6,005 | 6,574 | 6,637 | -8.7% | -9.5% |
| Profit Before Tax (PBT) | 5,767 | 8,870 | 6,035 | -35.0% | -4.4% |
| Profit After Tax (PAT) | 3,450 | 5,692 | 3,832 | -39.4% | -10.0% |
| EPS | 9.72 | 14.51 | 9.81 | -33.0% | -0.9% |
SWOT Analysis of Tata Motors
Strengths:
- Strong Brand Portfolio & Market Position – Well-established reputation with a broad customer base.
- Comprehensive EV Strategy – Aggressive push into the electric vehicle (EV) market, positioning for future growth.
- Global Presence – Operating in diverse international markets, reducing reliance on any single region.
- Diverse Product Portfolio – Wide range of vehicles, including passenger cars, commercial vehicles, and electric models.
Weaknesses:
- Dependence on Jaguar Land Rover (JLR) – Heavy reliance on the performance of its premium brand division.
- Impact of Supply Chain Disruptions – Ongoing challenges in sourcing components, particularly semiconductor shortages.
- Profitability Pressures – High operating costs and fluctuating demand affect overall profitability.
Opportunities:
- Expansion in the Electric Vehicle (EV) Market – Growing demand for EVs presents opportunities for further market share in the green vehicle segment.
- Growth in Commercial Vehicle Market – Increasing demand for commercial vehicles, especially in emerging markets.
- Global Expansion of JLR – Potential for continued growth through international markets and new model launches.
- Government Support for EVs & Green Technologies – Favorable policies and incentives promoting the shift to sustainable transportation.
Threats:
- Geopolitical & Economic Instability – Ongoing global uncertainty can affect operations and demand in key markets.
- Intense Competition in EV & Commercial Vehicle Segments – Rising competition from both traditional automakers and new EV startups.
- Declining Demand in Key Markets – Weakening demand in mature markets such as Europe and India could impact growth.
- Supply Chain Vulnerabilities – Ongoing disruptions in global supply chains, particularly in sourcing critical components.