Archives January 2025

Standard Glass Lining IPO
Standard Glass Lining IPO: Listing Gains or Long-Term Growth?

Standard Glass Lining IPO is a book built issue of Rs 410.05 crores. The issue is a combination of fresh issue of 1.50 crore shares aggregating to Rs 210.00 crores and offer for sale of 1.43 crore shares aggregating to Rs 200.05 crores. 

About Standard Glass Lining Technology Limited 

Established in September 2012, Standard Glass Lining Technology Limited specializes in manufacturing engineering equipment for India’s pharmaceutical and chemical industries. With a fully integrated in-house production process, the company delivers end-to-end solutions tailored to its clients’ needs. Their consumers are from paint, biotechnology, pharmaceutical, and food beverages. Their promoters play a crucial role in the growth of the company as they are skilled and experts in leadership.  

Its turnkey offerings encompass design, engineering, manufacturing, assembly, installation, and operational support for pharmaceutical and chemical manufacturing facilities.  

The product range includes: Reaction Systems and Storage, Separation, and Drying Systems. 

IPO Subscription Period 

  • Open Date: January 6, 2025 
  • Close Date: January 8, 2025 
  • Allotment Date: January 9, 2024 
  • Listing Date: January 13,2025 
  • Stock Exchanges: BSE and NSE 

Pricing Details  

  • Price Band: ₹133 – ₹140 per Share 
  • Face Value: ₹10 per Share 
  • Minimum Lot Size: 107 shares 
  • Investment Requirement: 
  • Retail Investors: Minimum ₹14980 (107 shares) 
  • Small Non-Institutional Investors (sNII): 14 lots (1498 shares) – ₹209720 
  • Big Non-Institutional Investors (bNII): 67 lots (7169 shares) – ₹1003660 

Reservation Structure 

  • Anchor Investors: 30% (8786809 shares)  
  • Qualified Institutional Buyers (QIB): 20% (5857875 shares) 
  • Non-Institutional Investors (NII): 15% (4393405 shares) 
  • Big NII (bNII): 10% 
  • Small NII (sNII): 5% 
  • Retail Investors: 35% (10251278 shares) 

Key Dates and Timeline 

  • IPO Open Date: Monday, January 6, 2025 
  • IPO Close Date: Wednesday, January 8, 2025 
  • Basis of Allotment: Thursday, January 9, 2025 
  • Initiation of Refunds: Friday, January 10, 2025 
  • Credit of Shares to Demat: Friday, January 10, 2025 
  • Listing Date: Monday, January 13, 2025 
  • Cut-off time for UPI mandate confirmation: 5 PM on January 8, 2025 

Book Running Lead Managers 

Standard Glass Lining Technology Limited has appointed prominent financial institutions as book-running lead managers for the IPO: 

  • IIFL Securities Ltd 
  • Motilal Oswal Investment Advisors Ltd 

Kfin Technologies Limited has been designated as the registrar for the IPO. 

Promoter Information 

  • Promoter: The promoters of the company are Nageswara Rao Kandula, Kandula Krishna Veni, Kandula Ramakrishna, Venkata Mohana Rao Katragadda, Kudaravalli Punna Rao and M/s S2 Engineering Services. 
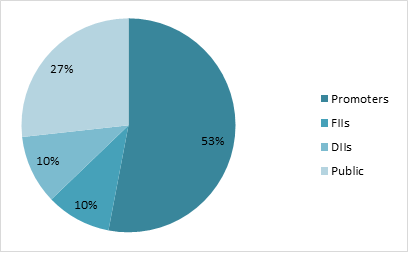
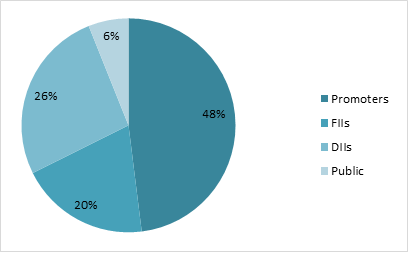
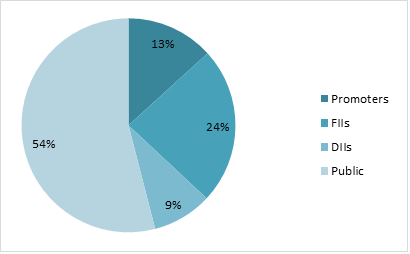
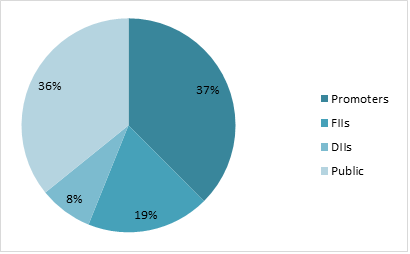
  • Shareholding: 
  • Pre-Issue: 72.49% 
  • Post-Issue: - 

Financial Highlights 

  • Revenue: In FY22 revenue was ₹241 crores, in FY23 it was ₹500 and in FY24 it is ₹549 crores. 
  • Profit after Tax (PAT): FY22- ₹25 crore, FY23- ₹53 crores and FY24- ₹60 crores. 
  • Net Worth: ₹448 crores 
  • Total Borrowing: ₹174 crores 

Key Performance Indicators (KPIs): 

  • ROE: 20.7% 
  • RoNW: 25.5% 
  • P/BV: 5.7 
  • EPS (Pre-IPO): ₹3.25 
  • EPS (Post-IPO): ₹3.64 
  • P/E Ratio (Pre-IPO): 43.04x 
  • P/E Ratio (Post-IPO): 38.5x 

IPO Objectives 

The Company intends to utilize the Net Proceeds for the following purposes: 

  • Financing capital expenditure requirements for purchasing machinery and equipment. 
  • Repaying or prepaying, in full or part, certain outstanding borrowings of the Company, as well as supporting its wholly-owned subsidiary, S2 Engineering Industry Private Limited, in repaying or prepaying outstanding borrowings from banks and financial institutions. 
  • Investing in S2 Engineering Industry Private Limited to meet its capital expenditure needs for purchasing machinery and equipment. 
  • Supporting inorganic growth through strategic investments and/or acquisitions. 
  • Covering general corporate purposes. 

Subscription Status (As of January 07, 2025) 

  • Retail: 19.97x 
  • QIB: 1.81x 
  • NII: 35.73x 
  • Overall Subscription: 18.16x 

Recommendation 

We recommend investors to apply the IPO of Standard Glass Lining Technology Ltd, as the revenue is growing year on year and the demand of the industry has risen which is beneficial for the company. The grey market premium as of January 07, 2025, it is approximately 71% showing a great listing gain to investors. For long term the valuation post IPO are also reasonable compared to its peer companies like GMM Pfaudler Ltd, HLE Glasscoat Ltd, Thermax Ltd, etc. provides a better opportunity to investor in long term. 

Garware Technical Fibres Ltd
Garware Technical Fibres Ltd: Q1 Earnings Miss Estimates, But Analyst Optimism Grows for 2025

Garware Tech Fibres Limited: Overview 

Garware-Wall Ropes (GWRL), founded in 1976, is one of India’s premier technical textiles companies, offering specialist solutions to the cordage and infrastructure industries around the world. The company produces and supplies high-performance polymer ropes, fishing nets, sports nets, safety nets, aquaculture cages, coated fabrics, agricultural netting. The company is among top 50 companies and top 20 in Technical textile manufacturing companies in India. The business segments and their revenue contributions are: Synthetic Cordage 82%, Fibre and Industrial Products & Projects 18%. The clients are working in area of fishing, shipping, aquaculture, coated fabrics, and government sectors. It has two manufacturing facilities located in Pune and Wai with capacity of 80 MT per day of technical fabrics. The company is in 75+ countries with 21,000+ SKUs and export contributes about 60% of its revenue. 

Latest Stock News (04-Jan-2025)

The company had announced a 4:1 bonus issue of shares earlier. This means that shareholders will be eligible for four bonus shares for every one share that they hold. This is the first time that the company had announced a bonus issue of shares. Since 2021, the company has also paid ₹16 per share as dividends and also carried out a buyback of equity shares earlier in 2024. The stock will be trading on its ex-bonus price from 6 January, 2025. 

Shareholding Pattern as on September 2024 

Key Stats 

Market Cap ₹9047 Crore 
Revenue ₹1428 Crore 
Profit ₹226 Crore 
ROCE 23.07% 
P/E 40.3 

Peer Comparison 

Amt in ₹ Cr MCap Sales PAT ROCE Asset Turn. EV/EBITDA D/E P/E 
Garware Tech 9047 1428 226 23.07% 0.81 26.51 0.13 40.12 
Jindal Poly Film 4249 4604 149 3.15% 0.39 12.23 28.59 
Welspun Living 15888 10398 693 16.1% 1.07 11.72 0.69 22.9 
S P Apparels 2278 1184 86 13.5% 0.97 15 0.41 26.5 
Monte Carlo Fas. 1626 1056 54 10.63% 0.7 13.56 0.89 30.2 

Financial Trends 

Amount in ₹ Cr 2020 2021 2022 2023 2024 
Revenue 953 1035 1189 1306 1326 
Expenses 775 830 966 1076 1054 
EBITDA 178 204 223 230 272 
OPM 19% 20% 19% 18% 21% 
Other Income 32 35 25 28 43 
Net Profit 141 158 165 172 208 
NPM 14.8% 15.3% 13.9% 13.2% 15.7% 
EPS 12.85 15.36 15.98 16.9 20.43 

Stock Price Analysis 

In terms of performance, Garware Technical Fibres has shown a return of -1.78% in one day, -81.24% over the past month, and -77.54% in the last three months. The stock has experienced fluctuations today, with a low of ₹885 and a high of ₹962.95. Over the past 52 weeks, the shares have seen a low of ₹623.22 and a high of ₹985.16, the volatility is stable and the price is in the growth trend as the financials are performing better.

Zomato Latest Innovation
Blinkit Launches 10-Minute Ambulance in Gurugram: Zomato Latest Innovation

Zomato Limited: Overview 

Zomato Limited, which was founded in 2010, is among the top online meal service platforms based on the quantity of food supplied. Among its features are meal delivery, dining-out options, loyalty plans, and more. As of December 31, 2020, Zomato had a significant footprint throughout 23 countries, with 131,233 active food delivery restaurants, 161,637 active delivery partners, and an average monthly food order of 10.7 million clients. It has three brands under its name Zomato, Hyperpure and Blinkit. The revenue contribution of Zomato is Food delivery 70%, Quick Commerce 24% and Going out is 6%. Zomato has active listed restaurants of 390,000 and clients are 16.4 mn monthly. Zomato is working in 1000+ cities and about 500 cities are added in FY22. The company has 28 subsidiaries, 1 trust and 1 associate. 

Latest Stock News (04-Jan-2025) 

Zomato‘s subsidiary has launched 10 min ambulance in Gurugram, this initiative has covered many eyes on internet. Blinkit is planning to expand this initiative to other major cities which can benefit the Zomato’s image among its customers. Hemal Jain has resigned from her Senior Management Personnel role from Zomato. Zomato has faced a GST charge of ₹401 crore with a penalty. This GST penalty was on the GST collected on the delivery charges. 

Shareholding Pattern as on September 2024 

Key Stats 

Market Cap ₹263309 Crore 
Revenue ₹15855 Crore 
Profit ₹742 Crore 
ROCE 1.14% 
P/E 355 

Peer Comparison 

Amt in ₹ Cr MCap Sales PAT ROCE Asset Turn. EV/EBITDA D/E P/E 
Zomato 263309 1588 742 1.14% 0.54 183 0.05 355 
Swiggy 121200 11247 -2304 -68.8 1.03 -67 0.15 – 
Info Edge 116956 2663 485 3.65 0.1 89.6 0.01 245 
FSN E-Commerce 47985 7077 42.9 6.87% 2.01 117 1121 
One 97 62641 8278 -2013 -8.5% 0.57 -46.9 0.01 – 

Financial Trends 

Amount in ₹ Cr 2020 2021 2022 2023 2024 
Revenue 2605 1994 4192 7079 12114 
Expenses 4909 2461 6043 8289 12071 
EBITDA -2305 -467 -1851 -1211 43 
OPM -88% -23% -44% -17% 0% 
Other Income 16 -200 793 682 846 
Net Profit -2386 -816 -1222 -971 351 
NPM -91.6% -40.9% -29.2% -13.7% 2.9% 
EPS -70096 -23126 -1.54 -1.14 0.4 

Stock Price Analysis 

Zomato has shown a return of -4.27% in one day, -2.55% over the past month, and 1.45% in the last three months. The stock has experienced fluctuations today, with a low of ₹271.7 and a high of ₹285.65. Over the past 52 weeks, the shares have seen a low of ₹121.7 and a high of ₹304.5. The stock price is in upward range and volumes traded have normalized from the past. Stock has given 6 times returns in 2 years showing the support from great financials of company.

CRISIL Upgrades Suzlon Energy Ltd Ratings
CRISIL Upgrades Suzlon Energy Ltd Ratings, ITAT Cancels ₹87.59 Crore Penalty

Suzlon Energy Limited: Overview 

Suzlon is a leading global provider of renewable energy solutions and a vertically integrated manufacturer of wind turbine generators (WTGs). The company’s operations span the design, development, and manufacturing of key components, including rotor blades, tubular towers, generators, control systems, gears, and nacelles. Additionally, Suzlon offers operation and maintenance (O&M) services in both India and international markets. As a comprehensive renewable energy solutions provider, Suzlon is involved in manufacturing, project execution, and O&M of wind turbine generators, along with the sale of related components. With over 20 GW of wind energy installations across 17 countries and 111+ wind farms in India boasting a total capacity of 13,880 MW, the company has a strong global footprint. Revenue contributions include ~73% from the sale of wind turbines and components, and ~27% from O&M services. 

Latest Stock News (3 January 2025)

CRISIL has upgraded Suzlon energy Ltd rating for loan of ₹3050 crores, long term rating A and short term rating of A1. It was the second time, CRISIL has updated the ratings. Income Tax Appellate Tribunal (ITAT) has decided the quantum appeal in favour of the company and JAO has cancelled the penalty order of ₹87.59 crore. In total the total penalty amount levied by National Faceless Penalty Centre, Income Tax Department is ₹260.3 crores. The CEO of SE Forge Ltd a wholly owned subsidiary of the Company has resigned from the position. 

Shareholding Pattern as on September 2024 

Key Stats 

Market Cap ₹83849 Crore 
Revenue ₹7881 Crore 
Profit ₹986 Crore 
ROCE 24.93% 
P/E 85 

Peer Comparison 

Amt in ₹ Cr MCap Sales PAT ROCE Asset Turn. EV/EBITDA D/E P/E 
Suzlon Energy 83849 7881 986 24.93% 1.03 62.65 0.06 85 
CG Power & Ind. 112609 8810 896 46.63% 1.56 85.9 0.01 125.6 
Hitachi Energy 64105 5850 199 17.85% 1.21 155.6 0.25 321.4 
Premier Energies 59750 3143 231 25.3% 1.11 116.8 0.55 254 
Triveni Turbines 24755 1854 315 38.5% 1.09 53.6 0.01 78.4 

Financial Trends 

Amount in ₹ Cr 2020 2021 2022 2023 2024 
Revenue 2973 3346 6582 5971 6529 
Expenses 3829 2809 5682 5137 5492 
EBITDA -856 537 900 833 1037 
OPM -29% 16% 14% 14% 16% 
Other Income -42 823 95 2739 -26 
Net Profit -2692 104 -177 2887 660 
NPM -90.5% 3.1% -2.7% 48.4% 10.1% 
EPS -4.01 0.1 -0.17 2.28 0.49 

Stock Price Analysis 

In terms of performance, Suzlon Energy has shown a return of -5.27% over the past month, and -18.2% in the last three months. Over the past 52 weeks, the shares have seen a low of ₹35.49 and a high of ₹86.04. The trades’ volumes have increased greatly and stock has also increased significantly indicating high volatility. The stock price now is at resistance level and might see some setbacks in coming weeks.

Sundaram Finance Expands in Tier-3 Tamil Nadu
Sundaram Finance Expands in Tier-3 Tamil Nadu: Emerging Business Opportunities

Sundaram Finance Ltd: Overview 

Sundaram Finance Ltd was established in 1954, with the business of financing the purchase of commercial vehicles and now it has diversified into many other segments like home finance, Mutual funds, general insurance, financial service distribution, etc. It has subsidiaries for different work segments like India Equipment Leasing Ltd, Sundaram Home Finance Ltd. It had a total of 680+ branches and as a group they had 1050+ branches worldwide. They have 671 branches for Asset Finance, 117 for Home Finance, 164 for General Insurance and 85 for Mutual Funds. They also have diesel finance and tyre finance to pay in 3-6 instalments. The total group AUM stood at 108,000 crore and 34,500 crore is under asset finance and 54,800 under AMC business. Sundaram Finance Ltd has risen term funding of ₹8000 crore from Banks, Mutual funds and Insurance companies. 

Stock News 

Sundaram Home Finance Ltd has announced plans to expand its presence in tier-3 towns in western Tamil Nadu under its ‘Emerging Business’ segment, citing strong growth potential. Currently it handles overs 15 branches in that region and aims to disburse ₹500 crore in next 12-18 months, with ₹50 crore targeted to specifically with EB. This move follows the successful launch of its Coimbatore branch. The Pollachi branch will offer small business loans of up to Rs 20 lakh to entrepreneurs for working capital and business growth. It will also target the affordable housing finance market, offering loans of up to Rs 35 lakh. 

Shareholding Pattern as on September 2024 

Key Stats 

Market Cap ₹51726 Crore 
Revenue ₹8013 Crore 
Profit ₹1603 Crore 
ROCE 9.21 % 
P/E 32.26 

Peer Comparison 

Amt in ₹ Cr MCap Sales PAT ROCE Asset Turn. EV/EBITDA D/E P/E 
Sundaram Fin. 51718 8013 1603 9.21% 0.12 16.85 4.5 32.27 
Shriram Fin. 114517 38466 7839 11.3% 0.16 11.08 3.97 14.57 
Muthoot Fin. 89907 14397 4413 13.2% 0.16 13.64 2.82 20.34 
L&T Fin. 35468 15009 2573 8.22% 0.13 12.58 3.5 13.8 
Chola Fin. 29156 29603 2054 10.73% 0.17 10.33 13.85 14.24 

Financial Trends 

Amount in ₹ Cr FY2020 FY2021 FY2022 FY2023 FY2024 
Revenue 4707 5292 5111 5501 7274 
Expenses 3649 3894 3628 3695 5050 
EBITDA 1058 1398 1483 1806 2224 
Financing Margin % 22% 26% 29% 33% 31% 
Net Profit 845 1223 1296 1510 1842 
NPM 18.0% 23.1% 25.4% 27.4% 25.3% 
EPS 71.25 104.7 105.6 119.5 129.3 

Stock Price Analysis 

Sundaram Finance Ltd.’s share price is experiencing a bullish surge today, rising by approximately 8.5%. As of January 2, 2025, the stock opened at ₹4,125.65 and reached a high of ₹4,418.80 during intraday trading. This increase comes on the heels of a challenging week, where the stock had previously dropped by 7.08%. The current trading volume stands at 354,146 shares, reflecting robust investor interest. From a technical standpoint, Sundaram Finance’s stock is currently navigating through significant resistance levels. The 52-week low is recorded at ₹3,447.00, while the 52-week high stands at ₹5,535.85.

Jai Corp Ltd: Gain 3% as NCLT Clears
Jai Corp Ltd: Gain 3% as NCLT Clears Pet Fibres-Share Buyback in Focus

Jai Corp Limited: Overview 

When Jai Corp Limited was first established on June 6, 1985, it produced a variety of goods, including spun yarn, PP Staple Fiber, FIBC Jumbo Bags, woven bags and fabrics, and geotextiles. Since then, businesses have expanded into real estate development, coils, and sheets of CR steel. 

As time went by, the company diversified into areas such as SEZ development, infrastructure projects, venture capital, and investment advisory services, reflecting the ability to adapt to opportunities that emerged. The company started its commercial production in 1987 with an HDPE/PP Woven Sacks manufacturing unit at Murbad, Maharashtra. The company then further expanded in 1990 and 1992 with other facilities. During the years, Jai Corp restructured itself several times. Notably, it changed its name from Jai Fibres Ltd to Jai Corp Limited in 1994 and also acquired subsidiaries in 2007 to enhance its presence in the venture capital and infrastructure sectors. To demonstrate its infrastructure-oriented strategy, Jai Corp established SPVs for electricity generation, transmission, and distribution in SEZ areas. In 2007–2008, the company ventured into the international market of real estate by incorporating a subsidiary in Mauritius. The group dissolved its Section 8 trust and merged its subsidiary, Jai Realty Ventures, with the aim to concentrate on its core business and streamline operations.  

Financial history indicates significant preference shares redemption in focus by Jai Corp. Some examples include between 2014 to 2019, there were several tranches of preference shares redeemed at premium with shareholder approvals for periodic rollover. In 2020, it was an order from National Company Law Tribunal approving the amalgamation of Jai Realty Ventures with the parent company to simplify corporate structure. The firm has also shown resilience under the COVID-19 pandemic where it managed to reopen facilities in stages and ended non-core operations such as spinning during 2020. 

Latest News (02-Jan-2025) 

Shares of Jai Corp Ltd gained 3% on August 27 after the NCLT approved the merger of promoter company Pet Fibres with Mega Pipes. Following the merger, Pet Fibres’ 2 lakh equity shares (0.2% stake) in Jai Corp will be transferred to Mega Pipes. 

Shareholders are advised to update or transfer their Depository Participant (DP) account details as shares in Pet Fibres’ DP account with ILFS will move to Mega Pipes’ DP account with MOSL. 

Jai Corp, established in 1985, is a diversified manufacturer specializing in steel, plastic processing, and spinning yarn, while expanding into SEZs, infrastructure, venture capital, and real estate. 

In its April-June earnings, Jai Corp reported a 4.56% YoY increase in revenue and a 148% YoY surge in net profit. The Board is set to meet on August 29 to discuss a potential share buyback. 

As of 12:10 pm, Jai Corp shares were trading 0.745% higher at ₹389.50 on the NSE. 

Returns Summary 

YTD 1 Month 6 Month 1 Year 2 Year 3 Year 5 Year 
-24.15% -33.72% -39.77% -37.89% 63.20% 101.46% 154.00% 

3 Years Return: Jai Corp Ltd. v/s Nifty 50 

Shareholding Pattern 

Key Metrics 

Metrics  
Mkt Cap (INR Cr):              4,441 Cr. 
52-week H/L:                      438/248 
PE Ratio:                             66.46 
Dividend yield:                   0.20% 
ROCE:                                3.81% 
P/B:                                    2.98 
NSE Code:                          JAICORPLTRD 

Financial Trends 

Year Sales (₹ Cr) Operating Profit (₹ Cr) OPM (%) Net Profit (₹ Cr) EPS (₹) Reserves (₹ Cr) Borrowings (₹ Cr) Fixed Assets (₹ Cr) Debt/Equity 
Mar-18 588 63 11% -1 -0.11 1,104 622 274 0.56 
Mar-19 636 71 11% -108 -6.06 1,016 580 279 0.57 
Mar-20 527 45 9% 34 1.88 1,048 470 256 0.45 
Mar-21 472 48 10% 93 5.19 1,139 330 230 0.29 
Mar-22 720 55 8% 53 2.95 1,197 236 224 0.2 
Mar-23 594 44 7% -14 -0.76 1,178 239 225 0.2 
Mar-24 463 48 10% 52 2.94 1,233 236 213 0.19 

Peer Comparison 

Company Price (Rs.) MCAP (Cr.) P/B P/E EPS (Rs.) ROE (%) ROCE (%) P/S EV/EBITDA 
Jai Corp 247.9 4,441.00 2.98 66.46 4.13 3.98 3.81% 9.52 44.12 
EPL 263.5 8,361.67 8.51 39.86 6.58 19.84 18.6 6.53 23.5 
Responsive Inds 262.65 6,902.50 7.37 206.02 1.26 3.48 5.6 10.54 63.87 
Shaily Engg. Plastic 1,511.70 6,848.56 15.25 167.64 8.89 8.75 11.07 11.12 63.42 
Jain Irrigation Sys 74.42 4,984.55 1.03 391.32 0.19 1.19 5.08 1.3 16.53 
Prince Pipes & Fitti 430.35 4,754.68 3.02 36.11 11.91 12.55 16.25 1.85 16.88 
Polyplex Corporation 1,369.40 4,299.20 6.27 5,243.11 0.26 -1.33 -1.36 3.04 83.13 
Jindal Poly Films 976.4 4,260.20 0.69 8.52 114.21 5.53 7.3 7.84 7.63 
Kingfa Science 3,471.00 4,159.94 6.37 30.99 110.83 23.24 30.26 2.8 20.39 
Xpro India 1,532.90 3,410.24 5.74 71.12 21.62 12.29 15.04 7.33 39.97 

Stock Analysis 

Jai Corp. Ltd. is a diversified company operating in the steel industry. Plastic production and ownership Facing a growing market trend, on January 2, 2025, Urban Infrastructure Holdings Private Limited (UIHPL) fell 19.99 % to ₹248.40 due to planned capital reduction by Jai Corp. over the last five years. The company’s sales growth was very negative at -6.14%, indicating problems with generating income. It is reported to be low. This may raise concerns among investors about the company’s ability to create dust in the stock market. The sudden change in the share price is the result of UIHPL’s planned capital reduction, which has raised concerns about the impact on Jai Corp’s financial health and future cash flows. Considering the new market reaction and related economic factors. Investors should be watchful: High P/L ratio signals that a stock may be overvalued. Negative output growth over five years indicates a structural situation. According to the report, UIHPL’s equity market is under uncertainty that would affect Jai Corp’s financial position. Some reported lower quarterly earnings and revenue. Broader economic indicators and current market conditions suggest caution. An investor should not scrutinize the financial condition and history of a company before investing. 

Considering all these factors investors are recommended to remain watchful as mentioned in the above para. Don’t invest until some major changes happens in the company’s operation.  Wait for the right time to make entry! 

Petronet LNG Limited Latest update
Petronet LNG Limited: Regulatory Challenges and Clean Energy Transition

Petronet LNG Limited: Overview 

In 1998, Petronet LNG Ltd. was established to oversee the planning, building, and operation of LNG import and regasification terminals, hence playing a crucial role in India’s energy sector. GAIL, Indian Oil Corporation (IOCL), Bharat Petroleum (BPCL), and ONGC formed the joint venture, each with an equal 12.5% share. It runs two main terminals, one in Dahej, Gujarat, with a capacity of 17.5 MMTPA and another in Kochi, Kerala, with a capacity of 5 MMTPA, for a total of 22.5 MMTPA. The majority of its revenue, around 95%-96%, comes from LNG sales, with the remaining 3%-4% from regasification services. GAIL, IOCL, and BPCL are key customers, accounting for about 95% of total revenue. Petronet is building a new LNG terminal at Odisha, with an initial capacity of 4 MMTPA and an estimated investment of ₹2,300 crore, as part of its infrastructure expansion to further solidify its position. The corporation is also increasing the storage and regasification capacities of its existing terminals. Furthermore, Petronet is expanding into the Green Hydrogen value chain, demonstrating its commitment to innovation, sustainability, and alignment with global clean energy trends. 

Shareholding Pattern as on September 2024 

Key Stats 

Market Cap ₹49190 Crore 
Revenue ₹54977 Crore 
Profit ₹3917 Crore 
ROCE 26.41% 
P/E 12.56 

Peer Comparison 

Amt in ₹ Cr MCap Sales PAT ROCE Asset Turn. EV/EBITDA D/E P/E 
Petronet LNG 49190 54977 3917 26.41% 2.22 6.67 0.15 12.56 
GAIL 125577 136080 11534 14.66% 1.15 7.25 0.23 10.89 
Adani Total Gas 80845 4687 702 21.2% 0.73 66.3 0.37 115.3 
Gujarat Gas 34970 16295 1225 20.51% 1.39 15.36 0.02 28.55 
Mahanagar Gas 12802 6437 1149 36.6 0.94 6.85 0.03 11.14 

Financial Trends 

Amount in ₹ Cr 2020 2021 2022 2023 2024 
Revenue 35452 26023 43169 59899 52729 
Expenses 31462 21323 37918 55045 47520 
EBITDA 3990 4700 5250 4854 5209 
OPM 11% 18% 12% 8% 10% 
Other Income 306 377 395 523 605 
Net Profit 2703 2939 3438 3326 3652 
NPM 7.6% 11.3% 8.0% 5.6% 6.9% 
EPS 18.02 19.59 22.92 22.17 24.35 

Stock Price Analysis 

The stock has not given any return in phase of 2017 to 2023, it was in consolidation and broke it and now it is trading at around its high level of ₹340 per share. The volume of shares traded has lowered these days compared to years in history. The stock might fall a little on basis of technical analysis for couple of months. 

Latest Stock News (2 January 2025) 

Petronet LNG Ltd. clarified that LNG terminal regulation does not fall under the PNGRB’s purview without amendments to the 2006 Act. The company highlighted its competitive regas charges, which constitute only 5-6% of delivered gas prices.

However, PNGRB’s recent paper criticized rising regas charges despite capacity expansion at the Dahej terminal, suggesting the need for regulatory oversight to ensure fair pricing. Foreign brokerage Citi flagged regulatory risks, issuing a “Sell” rating with a ₹310 target. Petronet shares dropped 5.49% to ₹328.50, signaling a negative start to 2025 after a 45% gain in 2024.

TVS Holdings Ltd Acquires Stake in TVS Digital Ltd
TVS Holdings Ltd: Acquires 100% Stake in TVS Digital Ltd to Strengthen IT Services Portfolio

Company Overview

TVS Holdings Ltd was established in 1962 as a Sundaram Clayton Ltd in Chennai by Venu Shrinivasan. Today it is known as TVS Holdings. It is a largest manufacturer of auto components and distribution groups in India. It is a leading supplier of aluminium die castings to automotive and non-automotive sectors. It makes aluminium castings for two wheelers, heavy commercial vehicles, passenger cars, etc. The export revenue contributes 26% in the total revenue. It has about 27 subsidiaries and 3 associate companies. It holds approximately 50% of TVS Motor Company Ltd. which is engaged in 2/3 wheelers segment. It also holds TVS Credit Services Ltd a retail finance firm also providing finance to TVS Motors. It has also acquired 50% of stake in Sundaram Holding USA Inc. The company has 5 manufacturing plants four in Tamil Nadu and one in USA, and is planning to expand to meet the additional demand from market.

Shareholding Pattern as on September 2024

Key Stats

Market Cap₹19020 Crore
Revenue₹42168 Crore
Profit₹952 Crore
ROCE14.98%
P/E19.8

Peer Comparison

Amt in ₹ CrMCapSalesPATROCEAsset Turn.EV/EBITDAD/EFCF
TVS Holdings190204216895214.98%0.966.768.24-1341
Bajaj Holdings1325131732740713.07%0.0317.30.001941
Cholaman.Inv.&Fin.10453522502385110.41%0.4515.587.38-36754
Maha. Scooter110061821750.88%0.0165.280.00206
Sundaram Fin. Hold67713155715.85%0.0724.10.00132

Financial Trends

Amount in ₹ Cr20202021202220232024
Revenue1985820299255913366240248
Expenses1744617911225992935634417
EBITDA24122388299243065830
OPM12%12%12%13%14%
Interest91092998514242043
Net Profit62759282413331782
NPM3.2%2.9%3.2%4.0%4.4%
EPS166.89160.24218.31321.16396.23

Stock Price Analysis

The prices of stock before 2014 were in range of ₹300 per share which now rose to high of ₹15,000 level. From 2015-2022 was the consolidation phase and after breaking it the stock has ran about 4 time to now reaching its all-time high. The stock has now seen a minor setback in its prices and it is trading at ₹ 9500 per share level. The volatility is increased and so the volumes of share traded every day compared to past.

Latest Stock News (2 January 2025)

TVS Holdings Ltd acquired a 100% stake in TVS Digital Ltd (formerly TVS Housing Ltd) from TVS Motor Company Ltd for ₹4.14 crore. This acquisition, a related party transaction conducted at arm’s length, makes TVS Digital a wholly-owned subsidiary. Headquartered in Chennai, TVS Digital operates in IT services and reported a turnover of ₹3.85 crore with a net profit of ₹0.27 crore in FY 2023-24. The move aligns with TVS Holdings’ strategy to consolidate non-automotive investments. Shares of TVS Holdings closed at ₹14,205, down 0.35% on the NSE.

Paytm stake sell by Softbank
Paytm: SoftBank Completely Exits One 97 Communications by Selling Its 1.4% Stake

Company Overview

One 97 Communications Ltd is a parent entity of Paytm, which was founded in 2000 by Vijay Shekhar Sharma. It is a one of leading payments and financial service platform which has transformed the business offerings in range of digital solutions to customers, merchants and enterprises. In digital payment segment it provides wallet based transactions, UPI, and POS merchant solutions. It provides loans, insurance, wealth management services through its platform. It has newly introduced Paytm Soundbox for merchants and small enterprises. In 2023, it partnered with Amadeus for travelling and ticket booking businesses. The main negative points of company are that its marketing expense is really high and is not performing its operations in compliance with RBI.

Shareholding Pattern as on September 2024

Key Stats

Market Cap₹62922 Crore
Revenue₹8278 Crore
Profit₹-2013 Crore
ROCE-8.4%
P/E

Peer Comparison

Amt in ₹ CrMCapSalesPATROCEAsset Turn.EV/EBITDAD/EFCF
One 97 Comm.629728278-2013-8.5%0.57-47.30.01-161
One Mobikwik469587514.38.96%1.12121.171.38-27.6
Info Edge11281926624833.650.186.630.01673
Just Dial85661100311.64.81%0.2319.50.02245

Financial Trends

Amount in ₹ Cr20202021202220232024
Revenue32792801497479909978
Expenses596446407358963410921
EBITDA-2685-1838-2384-1644-943
OPM-82%-66%-48%-21%-9%
Other Income-45356288410314
Net Profit-2958-1701-2369-1776-1422
NPM-90.2%-60.7%-47.6%-22.2%-14.3%
EPS-470.6-280.4-36.9-28.03-22.3

Stock Price Analysis

The share price has fallen from its IPO price of ₹1600 something to 370-400 per share levels, because of its overvaluation and not proper operations in compliance with RBI has affected the brand value among the retail customers. The share volumes have increased from the past as it has become more volatile stock because of constant news or trending in market. It is at resistance level and might fall from this level.

Latest Stock News

SoftBank has fully exited One97 Communications, the parent company of Paytm, by selling its remaining 1.4% stake. The Japanese conglomerate, which initially held an 18.5% stake during Paytm’s IPO in 2021, gradually reduced its holdings through open-market transactions. This marks the end of SoftBank’s investment in the fintech giant.

Bajaj Holdings & Investment Ltd
Bajaj Holdings & Investment Ltd: A Leading NBFC with Strong Market Performance and Investment Potential

Company Overview

Bajaj Holdings & Invest. Ltd, was demerged from Bajaj Auto Ltd. The manufacturing work was transferred into Bajaj Auto, wind farm business and financial services business was given to Bajaj Finserv Ltd, and the properties, assets, liabilities of Bajaj Auto is transferred to Bajaj Holdings & Investments Ltd. It is registered as NBFC with RBI and it holds more than 35% stake in both Bajaj Auto Ltd and Bajaj Finserv Ltd. The revenue segments for the firm are basically interest income, fair value gain/loss and dividend income. The investments are done in Equity and debt markets; the diversification is handled as 65% investments in equity market and 35% in debt funds to balance the risk of its portfolio.

Shareholding Pattern as on September 2024

Key Stats

Market Cap₹130761 Crore
Revenue₹1732 Crore
Profit₹7407 Crore
ROCE13.07%
P/E17.7

Peer Comparison

Amt in ₹ CrMCapSalesPATROCEAsset Turn.EV/EBITDAD/EFCF
Bajaj Hold & Inv.1307611732740713.07%0.0317.070.001941
Bajaj Finance422635622781537311.92%0.1716.943.74-73753
SBI Cards6331217749221012.54%0.3317.053.3-5526
Shriram Finance10898138466783911.27%0.1610.873.97-31635
Muthoot Finance8614414397413313.15%0.1613.312.82-9471

Financial Trends

Amount in ₹ Cr20202021202220232024
Revenue4354574845221702
Expenses134106117142140
EBITDA3013523673801562
OPM69%77%76%73%92%
Other Income30583451389646735967
Net Profit30803654412649467365
NPM708.0%799.6%852.5%947.5%432.7%
EPS268.8327.98364.5435.8652.7

Latest News

The Bajaj Group, home to some of India’s most prestigious companies, has consistently delivered exceptional value to its investors. Known for its strong fundamentals and reliable returns, the group has established itself as a powerhouse for long-term wealth creation.

With the highly anticipated IPO of Bajaj Housing Finance on the horizon, an analysis by ETMarkets highlights robust performance across the Bajaj Group’s diverse portfolio. Flagship companies such as Bajaj Finance, Bajaj Finserv, Maharashtra Scooters, and Bajaj Auto have achieved extraordinary growth, with stock prices soaring over 1000%, transforming early investors into millionaires.

Bajaj Finance stands out as a prime example, delivering a staggering 2876% return over the past decade. This impressive stock performance is underpinned by solid financial growth, including a profitability CAGR of 34% and sales CAGR of 29.8% between FY14 and FY24, making it one of the most celebrated stocks in the market.

Stock Price Analysis

The share price is in growing trend and is increasing before 2020 and is still rising because the company holds the Bajaj Auto Ltd and Bajaj Finserv Ltd and they have been doing well in the market. Since Covid-19, the stock has increased 7 times from that price levels. The share traded volumes are still normal but the financials are helping the stock prices reach at new higher levels.