Archives 2025

Asian Paints Q3 FY25 Results
Asian Paints Q3 FY25 Results: ₹1,128 Crore Net Profit, Margin & Volume Growth

Asian Paints Ltd: Overview 

Asian Paints Ltd. is India’s largest paint manufacturer and one of the leading paint companies globally. Founded in 1942, it operates in more than 15 countries and has over 26 paint manufacturing facilities worldwide. It is No.1 or No.2 in its each segment, showing a great brand. Its product portfolio extends beyond decorative paints to include industrial paints, coatings, home decor, and waterproofing solutions, serving residential, commercial, and industrial markets. It has more than 140,000 customers and 3000+ dealers and 160,000+ retail touchpoints. The company has filed approx. 21 patents, Asian Paints has established itself as the most recognizable brand in India’s paint market. Through initiatives like the ‘Beautiful Homes Service’ and online colour consultation tools, Asian Paints enhances customer experience, leveraging digital solutions to strengthen customer engagement. The Indian paints industry is projected to grow at a CAGR of 11-13% over the next five years, aiming to reach a valuation of ₹1.2 lakh crores by 2028. Demand for water-based paints, low-VOC (Volatile Organic Compounds) products, and anti-bacterial coatings is on the rise, driven by eco-conscious and health-focused consumers. Major players, such as Asian Paints and Berger Paints, are continuously investing in R&D for product innovation and are expanding manufacturing capacities to meet rising demand. Infrastructure growth and government focus on boosting the manufacturing sector are expected to increase demand for industrial coatings, especially in construction, automotive, and machinery sectors. Crude oil derivatives are key inputs for paint manufacturing, and price fluctuations can impact profit margins. 

Latest Stock News 

In Q3FY25, the company faced challenges due to continued muted consumer demand, which was further impacted by weak festive sales, a slowdown in urban markets, and seasonal fluctuations. Despite this, the company continued expanding its distribution network, reaching approximately 169,000 retail touchpoints. Beautiful Homes Painting Services and Trusted Contractor Services gained strong traction and continued to grow. The Projects and Institutional Business witnessed a notable demand surge, particularly from the Factories and Builders segment, with the government sector showing positive momentum after three quarters of sluggish activity. Innovation remained a key focus, with new product launches contributing over 12% of overall revenue in Q3. Backward integration projects, including VAM-VAE and White Cement, progressed as planned. The company also launched a new campaign for Ultima Protek, promoting its ultra-durable exterior paint. However, certain segments faced profitability challenges, with the Kitchen segment reporting a PBT loss of ₹5 crore in Q3 compared to breakeven last year, and the Bath segment incurring a PBT loss of ₹7 crore, similar to the previous year. Weak urban consumption affected overall growth, which stood at 5% in INR terms but reflected a strong 17.1% growth in constant currency terms. Regionally, Africa faced setbacks due to currency devaluation in Egypt and Ethiopia, while the Middle East registered robust double-digit growth, with the UAE emerging as a key growth market. 

Business Segments

  • Decorative Business: The Company offers interiors and exterior wall paints, waterproof solutions, textured coatings, etc. with major products like Royale, TruCare, Apcolite, etc. It includes service of Beautiful Homes Service which shares about 4% in total revenue of company and includes services for kitchens, wardrobes, bath fittings, Sanitaryware, decorative lightings, rugs, furniture, etc. provides customers every possible services.  
  • International Business: Asian Paints has a global footprint with manufacturing operations and markets across 15+ countries in the Middle East, South Asia, Southeast Asia, and the Caribbean. While international operations currently represent a smaller portion of total revenue, they contribute to the company’s goal of becoming a leading player in emerging markets.  
  • Industrial Business: The Company operates in the industrial coatings segment through a 50:50 joint ventures with PPG Industries Inc. It offers custom-formulated products for the automotive and industrial sectors, including automotive, marine, and packaging coatings, as well as industrial protective coatings. 

Subsidiary Information

  • Asian paints international Pvt Ltd.: Asian Paints International Private Limited (“APIPL”), Singapore, is a wholly-owned subsidiary of the Company and is the holding company for all of its subsidiary companies carrying out operations overseas. The principal activities of APIPL are those of investment holding and management. 
  • Asian Paints (Nepal) Pvt Ltd: Asian Paints (Nepal) Private, is a subsidiary company of the Company. Its principal business is the manufacturing and selling of paint products in Nepal. The revenue of AP Nepal was ₹335.04 crores with de-growth of 38.5% YoY.  
  • Obgenix Software Pvt Ltd: It is popularly known by the brand name “White Teak” is a subsidiary company of the Company. White Teak is engaged in the business of decorative lighting products, fans and other décor accessories. The revenue of White Teak was ₹133.43 crores with growth of 23.0% YoY.  
  • Weather seal Fenestration Pvt Ltd: It is a subsidiary company of the Company. Weatherseal is engaged in the business of uPVC windows and doors. The revenue of Weatherseal was ₹51.68 crores growth of 110.0% year on year. 

Q3 FY25 Earnings 

  • Revenue of ₹8549 crore in Q3 FY25 down by 6.08% YoY from ₹9103 crore in Q3 FY24.  
  • EBITDA of ₹1637 crore in this quarter at a margin of 19% compared to 23% in Q3 FY24. 
  • Profit of ₹1128 crore in this quarter compared to a ₹1475 crore profit in Q3 FY24. 

Financial Summary 

Amount in ₹ Cr Q3 FY24 Q3 FY25 FY23 FY24 
Revenue 9103 8549 34489 35495 
Expenses 7047 6913 28229 27910 
EBITDA 2056 1637 6260 7585 
OPM 23% 19% 18% 21% 
Other Income 186 193 431 821 
Net Profit 1475 1128 4195 5558 
NPM 16.2% 13.2% 12.2% 15.7% 
EPS 15.1 11.6 42.8 56.9 

Sundaram Finance Q3 Results
Sundaram Finance Q3 Results: 16% PAT Growth, ₹349 Cr Profit, 140% Dividend Declared, AUM Surges 19%

Sundaram Finance Ltd: Overview 

Sundaram Finance Ltd (SFL) is one of India’s leading non-banking financial companies (NBFCs), specializing in vehicle financing, housing finance, asset management, and general insurance. Established in 1954, the company has built a strong reputation for trust and financial stability, offering a diversified portfolio of financial services. With a robust presence across India, SFL primarily focuses on financing commercial vehicles, passenger cars, construction equipment, and tractors. The company has also expanded into home loans, mutual funds, and insurance through its subsidiaries, ensuring a comprehensive financial ecosystem for its customers. SFL’s business model revolves around prudent lending practices, customer-centric policies, and efficient risk management. The company has successfully navigated economic cycles while maintaining consistent growth in its assets under management (AUM). Its well-capitalized balance sheet, disciplined underwriting, and strategic expansion into rural and semi-urban areas have helped SFL maintain a strong foothold in India’s financial sector. The Indian non-banking financial company (NBFC) sector is poised for steady growth, driven by increasing vehicle ownership, rising infrastructure investments, and a growing demand for housing finance. The NBFC segment plays a crucial role in providing credit to sectors underserved by traditional banks, including small businesses and rural borrowers. With India’s economy expected to expand steadily, demand for vehicle and equipment financing is anticipated to grow, benefiting players like Sundaram Finance. However, challenges such as regulatory changes, interest rate fluctuations, and competition from fintech companies could impact growth in the NBFC space. Despite these challenges, well-managed companies with strong balance sheets and diversified portfolios, such as SFL, are well-positioned to capitalize on growth opportunities. 

Latest Stock News 

The total Assets Under Management (AUM) saw a 19% increase, reaching ₹50,199 crore. On a consolidated basis, the AUM stood at ₹75,708 crore as of December 2024, compared to ₹63,658 crore in December 2023. The Company’s gross stage 3 assets, which include loans overdue for more than 90 days, were recorded at 1.70% as of December 2024, slightly improving from 1.77% in December 2023. Net Stage 3 assets also showed an improvement, declining to 0.97% from 1.02% during the same period. The company announced key leadership appointments and reappointments. Mr. Mukund Raghavan was appointed as the Chief Risk Officer for a three-year term effective from November 15, 2024, replacing Mr. N. Raman, who is set to retire on November 14, 2024. Additionally, Mr. V. Vaasen was reappointed as the Head of Internal Audit for another three-year term starting March 1, 2025. Further strengthening its leadership team, the company appointed Mr. Ajit Narasimhan as Head of Strategy & Planning effective October 1, 2024, and Mrs. Bama Balakrishnan as Senior Vice President – Finance from October 7, 2024 

Business Segments

  • Vehicle Finance: This segment is the company’s largest division, offering loans for commercial vehicles, passenger cars, two-wheelers, and construction equipment. It maintains a strong market presence, catering to retail and fleet operators. 
  • Housing Finance: This division is a subsidiary Sundaram Home Finance, provides home loans and mortgage-backed products, focusing on affordable housing and mid-segment home buyers. 
  • Asset Management: This segment is managed through Sundaram Asset Management Company, which handles mutual fund investments, catering to both retail and institutional investors, with a strong focus on equity and debt funds. 
  • General Insurance: This segment operates through Royal Sundaram General Insurance, offering motor, health, and commercial insurance products, ensuring a diversified financial portfolio. 

Subsidiary Information: 

  • Sundaram Home Finance Ltd: Sundaram Home Finance Ltd. is the housing finance subsidiary of Sundaram Finance, focusing on providing affordable housing loans and loan products for residential properties. The company caters to salaried and self-employed individuals, helping them purchase, construct, or renovate homes. It operates across various Indian cities, supporting the government’s push toward affordable housing through competitive interest rates and flexible loan structures. With a growing home loan portfolio, Sundaram Home Finance has been instrumental in expanding Sundaram Finance’s footprint in the real estate finance segment, leveraging its parent company’s strong credibility and customer-centric approach. 
  • Sundaram Asset Management Company Ltd: Sundaram Asset Management Company Ltd. is a leading player in the mutual fund industry, managing a diversified portfolio of equity, debt, and hybrid funds. It caters to retail investors, corporates, and institutional clients, offering financial solutions that align with varying risk appetites. The company has a strong reputation in equity-oriented schemes and has consistently delivered value through its research-driven investment strategy. With increasing investor participation in capital markets, Sundaram Asset Management continues to expand its offerings, embracing digital transformation to enhance customer experience and operational efficiency. 
  • Royal Sundaram General Insurance Co. Ltd: Royal Sundaram General Insurance is a key subsidiary offering a broad range of insurance products, including motor, health, fire, marine, and commercial insurance. As one of India’s premier private general insurers, the company has a strong presence in retail and corporate segments. It has built a vast distribution network and developed innovative insurance solutions to cater to evolving customer needs. The company’s robust underwriting expertise and a strong claims settlement record position it as a leading player in the general insurance industry. Sundaram Finance’s backing has helped Royal Sundaram scale its operations and enhance financial inclusion through customized products and digital initiatives. 
  • Sundaram Finance Holdings Ltd: Sundaram Finance Holdings Ltd. is the investment arm of Sundaram Finance, specializing in strategic investments across the auto components and financial services sectors. It holds key stakes in various businesses, helping Sundaram Finance expand its market influence while ensuring capital appreciation through long-term investment strategies. The company also supports the parent’s non-banking financial activities by investing in allied industries that align with Sundaram Finance’s core business vision. With a disciplined approach to capital allocation, Sundaram Finance Holdings continues to contribute to the financial stability and expansion of the group. 
  • Sundaram Finance Ltd. (Retail Deposits & Wealth Advisory Division): This division focuses on offering fixed deposits, wealth management, and advisory services. Sundaram Finance is renowned for its safe and customer-centric deposit schemes, attracting retail and institutional investors seeking stable returns. Its wealth advisory arm helps clients with financial planning, investment strategies, and portfolio management. The company leverages its decades-long trust and financial expertise to provide customized wealth solutions. The division plays a crucial role in diversifying Sundaram Finance’s revenue streams and enhancing customer engagement beyond traditional lending services. 

Q3 FY25 Earnings 

  • Revenue of ₹2190 crore in Q3 FY25 up by 20.2% YoY from ₹1821 crore in Q3 FY24.  
  • Financing Profit of ₹642 crore in this quarter at a margin of 29% compared to 31% in Q3 FY24. 
  • Profit of ₹455 crore in this quarter compared to a ₹506 crore profit in Q3 FY24. 

Financial Summary 

Amount in ₹ Cr Q3 FY24 Q3 FY25 FY23 FY24 
Revenue 1821 2190 5501 7274 
Interest  910 1087 2410 3418 
Expenses 351 462 1285 1632 
Financing Profit 561 642 1806 2224 
Financing Margin 31% 29% 33% 31% 
Other Income 17 43 -80 
Net Profit 506 455 1510 1842 
NPM 27.8% 20.8% 27.4% 25.3% 
EPS 38.5 41 119.5 129.3 
Siemens Ltd stock news
Siemens Ltd: Order Backlog, Growth Trends & Future Potential

Siemens Ltd: Overview 

Siemens Ltd., a subsidiary of Siemens AG, is a leading technology powerhouse operating across multiple sectors in India, including electrification, automation, and digitalization. The company operates through well-diversified business segments, including Smart Infrastructure, Digital Industries, Mobility, Energy, and Healthcare, catering to a wide range of industries such as power utilities, transportation, manufacturing, and building automation. Siemens has a significant presence across India, with multiple manufacturing facilities, R&D centers, and a vast service network, ensuring seamless execution of large-scale infrastructure and technology projects. The Make in India and Atmanirbhar Bharat initiatives have significantly boosted local manufacturing, leading to an increased demand for automation, smart grids, and energy-efficient solutions areas where Siemens Ltd. plays a critical role. The ongoing urbanization, expansion of metro rail projects, and the push for smart cities are expected to drive substantial demand for Siemens’ mobility and smart infrastructure solutions. The power sector is undergoing a major shift towards renewable energy, energy storage, and grid modernization, opening up new opportunities for Siemens’ digital grid and energy-efficient solutions. Additionally, the industrial automation market in India is expected to grow at a CAGR of over 12%, propelled by advancements in IoT, AI-driven automation, and robotics. Siemens Ltd., being a global leader in these areas, is well-positioned to capitalize on the growing demand for intelligent automation and sustainable energy solutions in industries such as manufacturing, automotive, healthcare, and transportation.  

Latest Stock News 

Private sector capital expenditure is primarily focused on emerging technologies such as semiconductors, batteries, solar photovoltaic systems, and electric vehicles, driving significant investment in these areas. The demand for energy transmission and energy efficiency solutions has also seen an uptick, contributing to a robust order backlog of ₹482.6 billion. The company has maintained strong growth momentum in its base business, securing multiple large orders in the Smart Infrastructure (SE) and Mobility (MO) segments, while advanced ordering normalization was observed in Digital Industries (DI) and Low-Voltage Motors (LVM). For FY24, revenue growth was reported at 15.0% in the product business and 13.2% in the project business, supported by double-digit orders and revenue expansion, particularly in electrification and building products. Profitability improved due to a better product mix, favourable price realization, and higher revenue generation. Notable orders in FY24 included Bangalore Metro Electrification and the propulsion system for 6,000 HP locomotives, reflecting Siemens’ growing presence in infrastructure and transportation. Order growth was particularly strong in grid technologies, oil & gas, and turbine segments, further bolstering the company’s long-term outlook. Q4 FY24 EBITDA increased by 3%, although it was impacted by certain one-time factors. Additionally, the Siemens Energy demerger remains on track, positioning the company for a more streamlined focus on its core operations and strategic growth areas. 

Stock Potential 

Siemens Ltd. is uniquely positioned to benefit from India’s ambitious industrial and infrastructure development plans. The company has significant growth potential in sectors like renewable energy, smart grid solutions, industrial automation, and digital twin technology. With increasing government spending on railways, metros, and smart city projects, Siemens’ mobility and electrification solutions are expected to see strong growth in the coming years. Its ability to offer end-to-end industrial automation and smart infrastructure solutions makes it a preferred partner for large-scale infrastructure and manufacturing projects. Siemens also has a strong backlog of orders and a healthy balance sheet, which provides financial stability and the ability to invest in next-generation technologies. With expanding R&D capabilities, partnerships with Indian industries, and an increasing share of service-based revenues, Siemens Ltd. is poised for long-term sustainable growth. 

Analyst Insights 

We are bullish on Siemens Ltd., considering its strong market position, diversified portfolio, and long-term growth prospects in India. The company has consistently demonstrated revenue growth, aided by strong order inflows from key sectors like power distribution, railways, and industrial automation. Analysts expect Siemens’ revenue growth to remain in double digits, driven by increasing demand for energy-efficient solutions, digital automation, and infrastructure expansion. Margins are expected to improve as the company scales up its digital services and automation-driven businesses, which carry higher profitability. While short-term headwinds such as global supply chain disruptions, semiconductor shortages, and cost inflation may impact near-term earnings, the long-term outlook remains robust. Siemens’ focus on high-growth areas like smart mobility, EV infrastructure, and digital grids further strengthens its competitive advantage. Analysts recommend long-term investment in Siemens Ltd, considering its strong order book, expanding market opportunities, and innovation-driven approach that ensures steady and sustainable growth. The company’s ability to leverage global expertise while tailoring solutions for the Indian market gives it a strategic edge, making it a preferred choice for infrastructure and automation investors. 

Ambuja Cement and UltraTech Q3 FY25 Results
Q3 FY25 Results: Ambuja Cement Profit Surges 157% YoY to ₹2,115 Cr, UltraTech Profit Falls 17% to ₹1,470 Cr; Revenue Growth Continues

Ambuja Cements Ltd: Overview 

Ambuja Cements Ltd, a part of the Adani Group, is one of India’s leading cement manufacturers, known for its strong market presence and commitment to sustainable development. The company operates through an extensive network of integrated cement plants, grinding units, and a robust distribution system that spans across the country. Ambuja specializes in producing high-quality cement products, including Ordinary Portland Cement (OPC) and Portland Pozzolana Cement (PPC), catering to a wide range of construction needs in residential, commercial, and infrastructure projects. With a focus on operational efficiency, cost optimization, and sustainable practices, Ambuja Cements has adopted advanced manufacturing technologies, waste heat recovery systems, and renewable energy initiatives to enhance its production capabilities and reduce carbon emissions. Additionally, the company benefits from its strong brand recognition, extensive dealer network, and continuous investments in research and development, positioning itself as a key player in the competitive cement industry. The Indian cement industry is poised for strong growth, driven by increasing infrastructure development, housing demand, and government initiatives such as the Pradhan Mantri Awas Yojana (PMAY) and Smart Cities Mission. The sector is expected to benefit from large-scale investments in roads, highways, metros, and rural development projects. The growing emphasis on sustainability and green cement production is also reshaping the industry, with companies investing in alternative fuels, energy-efficient technologies, and carbon reduction strategies. While the industry faces challenges such as rising input costs, supply chain disruptions, and environmental regulations, demand remains robust due to strong economic growth, rapid urbanization, and continued policy support from the government. 

Latest Stock News 

In Q3 FY25, the company achieved the highest percentage of trade sales among peers at 71%, primarily catering to the profitable Individual House Builder (IHB) segment. Premium cement contributed 26% of trade sales during the quarter, positioning the company among the industry leaders in this segment. Since the Adani acquisition from Holcim in September 2022, cost reductions have amounted to 17%, significantly improving operational efficiency. The sanctioning of additional houses under the Pradhan Mantri Awas Yojana has led to increased demand in Q3, with further improvement expected in Q4 FY25. The office market is experiencing robust growth, with leasing space projected to expand by 8% to 10%, driven by the rapid development of Global Capability Centers. Additionally, India’s data center industry is witnessing exponential growth, fueled by advancements in AI and the nationwide rollout of 5G technology, with capacity expected to grow by 66% by 2026. Government capital expenditure on infrastructure, which accounts for 25-30% of cement demand, is anticipated to accelerate in the second half of FY25. In Q3 FY25, the company added 631 million metric tonnes of new limestone reserves, bringing the total reserves to approximately 8,300 million metric tonnes. Freight and forwarding costs were reduced by 15%, primarily due to network optimization, which resulted in a 7% reduction in primary lead distance and a 17% reduction in secondary lead distance. 

Q3 FY25 Earnings 

  • Revenue of ₹9329 crore in Q3 FY25 up by 14.8% YoY from ₹8129 crore in Q3 FY24.  
  • EBITDA of ₹1712 crore in this quarter at a margin of 18% compared to 21% in Q3 FY24. 
  • Profit of ₹2620 crore in this quarter compared to a ₹1091 crore profit in Q3 FY24. 

UltraTech Cements Ltd: Overview 

UltraTech Cement Ltd, a subsidiary of the Aditya Birla Group, is India’s largest cement manufacturer and a dominant player in the global cement industry. With an extensive production capacity of over 140 million tonnes per annum (MTPA), UltraTech is known for its wide product portfolio, which includes Ordinary Portland Cement (OPC), Portland Pozzolana Cement (PPC), Ready-Mix Concrete (RMC), white cement, and specialty building products. The company has a strong presence across India, the Middle East, and other international markets, supported by its integrated cement plants, clinkerization units, and grinding stations. UltraTech’s growth strategy is driven by continuous capacity expansion, efficiency improvement, and sustainability initiatives, including the use of renewable energy, alternative raw materials, and carbon capture technologies. The company has also been actively acquiring assets to strengthen its market leadership, including the integration of assets from Jaypee Cement and Binani Cement. UltraTech’s financial strength, operational excellence, and commitment to innovation make it a formidable force in the cement industry. The Indian cement industry is expected to witness steady growth, supported by rising infrastructure investments, increased urbanization, and favourable government policies. The demand for cement is projected to rise due to massive public and private sector investments in roads, railways, ports, and urban housing projects. Additionally, the real estate sector’s recovery, coupled with rising per capita cement consumption, is expected to boost the industry’s long-term prospects. However, the sector faces challenges such as rising costs of raw materials, energy, and logistics, which could impact profitability. The industry is also undergoing a transformation with increased emphasis on sustainability, digitalization, and advanced manufacturing processes to improve efficiency and reduce carbon footprints. UltraTech Cement, with its scale, strong distribution network, and technological advancements, is well-positioned to leverage these trends and maintain its leadership position in the cement market. 

Latest Stock News 

The infrastructure segment experienced a decline due to pollution control measures implemented in Delhi and nearby regions, as well as project delays caused by the farmers’ agitation in Punjab. Additionally, the average lead distance reduced to 377 km in Q3 FY25 compared to 397 km in Q3 FY24. The housing segment, on the other hand, registered growth across most regions, except in Prayagraj, where restrictions on heavy vehicle movement due to Kumbh Mela preparations impacted demand. In Maharashtra, the infrastructure sector witnessed a slowdown due to lower fund flows attributed to the state assembly elections, while in Gujarat, housing demand remained largely flat. UltraTech Cement made a strategic investment by acquiring a non-controlling financial stake of 8.42% in Star Cement Limited at a total cost of ₹776 crore. The clinker conversion ratio improved to 1.45 in Q3 FY25, compared to 1.43 in the same quarter of the previous year, reflecting enhanced efficiency in cement production. Additionally, the share of green power in the overall energy mix increased to 33.4% in Q3 FY25, up from 32.0% in Q2 FY25. Additionally, the company signed an agreement to deploy approximately 100 electric trucks to transport 75,000 metric tonnes of clinker monthly from its Dhar Cement Works in Madhya Pradesh to Dhule Cement Works in Maharashtra, covering a 400 km round trip. Realizations declined by 9.6% year-on-year but showed a slight improvement of 1.4% on a quarter-on-quarter basis. 

Q3 FY25 Earnings 

  • Revenue of ₹17193 crore in Q3 FY25 up by 2.17% YoY from ₹16740 crore in Q3 FY24.  
  • EBITDA of ₹2886 crore in this quarter at a margin of 17% compared to 19% in Q3 FY24. 
  • Profit of ₹1474 crore in this quarter compared to a ₹1775 crore profit in Q3 FY24. 
Tata Chemicals Q3 FY25 Results
Tata Chemicals Q3 FY25 Results: Reports ₹53 Crore Loss as Revenue Declines 3.8%

Tata Chemicals Ltd: Overview 

Tata Chemicals Ltd., a key player in the global chemicals and industrial products industry, operates in diversified segments including basic chemistry, consumer products, and specialty chemicals. Established as part of the Tata Group, the company has a strong presence in India and international markets such as the U.S., UK, and Africa. Tata Chemicals is known for its leadership in soda ash production, which is a critical raw material for glass, detergents, and other industrial applications. The company also manufactures salt, bicarbonate, silica, and fertilizers, supporting industries ranging from agriculture to pharmaceuticals. With a commitment to sustainability, Tata Chemicals integrates green chemistry into its operations, ensuring responsible manufacturing processes and resource utilization. The company has been investing in research and development, particularly in advanced materials, biotechnology, and sustainable solutions to drive long-term growth. The chemical industry plays a crucial role in global economic development, with increasing demand for specialty and performance chemicals in industries such as automotive, pharmaceuticals, agriculture, and consumer goods. The global chemical market is projected to witness steady growth driven by industrialization, urbanization, and sustainability initiatives. In India, the government’s focus on self-reliance (Atmanirbhar Bharat) and incentives for domestic chemical manufacturing are expected to boost the sector. The specialty chemicals market, in particular, is seeing rapid growth due to technological advancements and shifting consumer preferences. Challenges such as raw material price fluctuations, regulatory requirements, and environmental concerns continue to impact the industry. However, Tata Chemicals, with its diversified portfolio and strong international presence, is well-positioned to capitalize on the rising demand for sustainable and high-value chemical solutions. 

Latest Stock News 

The demand in the US and Western US markets has shown a slight decline, while China’s exports have moderated and remain muted. In India, soda ash prices have dropped by 15% year-on-year, primarily due to lower-priced imports. Kenya experienced lower volumes, although prices remained steady. Rallis India, a subsidiary, reported weaker results due to continued sluggishness in export demand. The company is now focusing more on customer engagement and expanding capacity, with a particular emphasis on India. China continues to be a net exporter, mainly catering to the Southeast Asian market. UK had stable volumes; however, the prices had softened. Kenya saw marginally higher volume and marginally higher prices sequentially.  A phased capital expenditure (Capex) plan of 300,000 tons has been set in motion across the USA, Kenya, and India. Additionally, two major plant shutdowns occurred this year, leading to higher production volumes compared to the previous quarter, though restarting these facilities requires approximately ₹30 crores. Year-on-year, EBITDA has declined by ₹108 crore, primarily due to a 12% increase in employee benefits and a 16% rise in freight costs. The company’s total capacity stands at around 250,000 tons per quarter, and it is currently operating at 235,000 tons, reflecting a high utilization rate. 

Business Segments

  • Basic Chemistry Products: This segment includes soda ash, sodium bicarbonate, salt, and limestone, which are used in industries such as glass, detergents, and textiles. Tata Chemicals is one of the leading producers of soda ash globally and serves key markets in India, the U.S., and Europe. 
  • Specialty Products: Tata Chemicals has been focusing on the development of specialty chemicals, including Nano-materials, Nutraceuticals, and biotechnology-based solutions. The company’s investments in lithium-ion battery recycling and energy storage materials position it as a future-ready player in the emerging clean energy sector. 
  • Consumer Products: Tata Chemicals has a growing portfolio in consumer essentials, including Tata Salt, which is one of India’s most trusted brands. The company has expanded into pulses, spices, and nutritional supplements, leveraging its strong distribution network. 
  • Agri-Solutions: The Company provides high-quality fertilizers, crop protection solutions, and farm inputs to support sustainable agriculture. With a focus on soil health and productivity enhancement, Tata Chemicals contributes to India’s agricultural growth 

Subsidiary Information: 

  • Tata Chemicals North America (TCNA): Tata Chemicals North America operates in the U.S. and is a leading producer of soda ash. The company owns one of the world’s largest natural soda ash deposits in Wyoming, giving it a cost advantage and securing a strong supply chain for North American and global markets. TCNA plays a crucial role in Tata Chemicals’ international expansion strategy. 
  • Tata Chemicals Europe (TCE): Tata Chemicals Europe focuses on manufacturing and supplying soda ash, sodium bicarbonate, and other industrial chemicals in the European market. The company has been actively investing in carbon capture and sustainable manufacturing technologies to align with global environmental regulations and reduce carbon emissions. 
  • Rallis India Ltd: A subsidiary of Tata Chemicals, Rallis India is a major player in the agrochemicals sector. It specializes in crop protection solutions, seeds, and specialty nutrients, catering to the needs of Indian farmers. Rallis India’s strong research capabilities and distribution network contribute significantly to Tata Chemicals’ agri-business. 
  • Tata Chemicals Magadi Ltd: Located in Kenya, Tata Chemicals Magadi is Africa’s largest soda ash manufacturer. The subsidiary has access to extensive trona reserves, ensuring a consistent supply of raw materials for soda ash production. It serves markets across Africa and Asia, strengthening Tata Chemicals’ global footprint. 
  • Innovation Centre (Tata Chemicals Innovation Hub): Tata Chemicals has set up a dedicated research and innovation center to focus on next-generation materials, biotechnology, and energy solutions. This subsidiary supports the company’s long-term vision of becoming a leader in sustainable and high-tech chemical solutions. The innovation hub plays a vital role in driving new product development and improving operational efficiencies. 

Q3 FY25 Earnings 

  • Revenue of ₹3,590 crore in Q3 FY25 down by 3.71% YoY from ₹3,730 crore in Q3 FY24.  
  • EBITDA of ₹34 crore in this quarter at a margin of 11% compared to 15% in Q3 FY24. 
  • Loss of ₹21 crore in this quarter compared to a ₹194 crore profit in Q3 FY24. 

Financial Summary 

Amount in ₹ Cr Q3 FY24 Q3 FY25 FY23 FY24 
Revenue 3730 3590 16789 15421 
Expenses 3188 3584 12969 12574 
EBITDA 542 34 3820 2847 
OPM 15% 0.9% 23% 18% 
Other Income 98 28 218 -507 
Net Profit 194 -21 2434 435 
NPM 5.2% -0.6% 14.5% 2.8% 
EPS 6.2 -2.1 90.9 10.5 
Divi’s Laboratories Ltd Q3 FY25 Results
Divi’s Laboratories Ltd: Q3 FY25 Earnings, 64.5% Profit Growth & Stock Surge

Divi’s Laboratories Ltd: Overview 

Divi’s Laboratories Ltd., a major global API (Active Pharmaceutical Ingredients) manufacturer, was founded in 1990 as Divis Research Center, focusing initially on Research & Development. Today, it stands as one of the largest API companies worldwide, specializing in Intermediates, Nutraceuticals, and custom synthesis for innovator pharmaceuticals. It has a significant export-oriented business, with a presence in over 100 countries, supplying around 160 diverse products. Divi’s Laboratories Ltd. has achieved significant milestones in its growth and operations. In 2006-2008, the company developed Divi’s Pharma SEZ in Visakhapatnam for Nutraceuticals production, expanding its custom synthesis and Nutraceuticals portfolio to meet rising export demand. In 2011, Divi’s launched the DSN SEZ Unit at Visakhapatnam, increasing production capacity in generic and custom synthesis segments. From 2014-2018, Divi’s Laboratories passed multiple international regulatory inspections, including from the US FDA and COFEPRIS (Mexico), establishing EIR status for Unit-II, Visakhapatnam, which addressed previous regulatory concerns. These projects boosted Divi’s role in generic and big pharma markets. In line with its dedication to innovation and compliance, Divi’s has research centers in Hyderabad and at manufacturing sites, focusing on custom synthesis and process innovations. With two subsidiaries Divi’s continued investments in R&D, global regulatory compliance, and strategic expansion reinforce its commitment to high-quality pharmaceutical solutions, positioning it as a prominent player in the global API market.  

Latest Stock News 

The Phase 1 Green 3 project commenced its operations in January 2025, marking a significant milestone for Divi’s Laboratories by enhancing its production capacity. However, logistical challenges arose due to restrictions and disruptions in the Red Sea, forcing transportation to be rerouted through South Africa, which significantly increased logistics costs during the quarter. Despite these temporary cost pressures, freight expenses are anticipated to ease in the coming years, aided by Divi’s strong client relationships that have ensured customer retention. Material consumption remained stable, accounting for approximately 40% of the total revenue for the reporting period. Export revenue continued to be a key driver of overall earnings, contributing nearly 80% to total revenue, with shipments to Europe and the United States making up 87% of total exports. The company’s Nutraceuticals segment demonstrated notable growth, gaining market share within its category and generating revenue of ₹170 crore. Additionally, Divi’s Laboratories has an ongoing capital work in progress amounting to ₹1,170 crore, earmarked as capital expenditure for the current fiscal year, with ₹735 crore specifically allocated for the Kakinada project. The first phase of the Kakinada project is expected to be operational within six months, further strengthening Divi’s long-term growth prospects. As of December 31, 2024, the company reported a strong financial position with ₹3,659 crore in cash reserves. In the generics business, despite industry-wide pricing pressures, Divi’s has maintained stability through strategic pricing measures. Additionally, the company has implemented a well-structured inventory buffer, ensuring a diversified and uninterrupted supply chain that supports continued growth and resilience against market fluctuations. 

Business Segments

  • Generic APIs: Divi’s is a leading manufacturer of generic APIs, catering to pharmaceutical companies worldwide. It specializes in high-value APIs such as Naproxen, Dextromethorphan, Gabapentin, and Levetiracetam. The company’s backward integration and cost-efficient manufacturing give it an edge in this segment. 
  • Custom Synthesis: This segment involves contract manufacturing and development services (CDMO) for global pharmaceutical companies. Divi’s provides specialized synthesis solutions for patented molecules and intermediates used in drug development. 
  • Nutraceuticals: Divi’s has expanded into the growing Nutraceuticals market, offering high-quality carotenoids, vitamins, and other health supplements. The segment aligns with increasing consumer preference for wellness products and functional foods. 
  • Peptide and Oligonucleotide Manufacturing: With advancements in biotechnology, Divi’s has ventured into the synthesis of peptides and oligonucleotides, which are critical for new-generation therapeutics, including RNA-based drugs. 

Subsidiary Information

  • Divi’s Laboratories (USA) Inc.: Divi’s Laboratories (USA) Inc. serves as the company’s North American arm, focusing on marketing and distribution of pharmaceutical products across the United States and neighboring countries. This subsidiary ensures that Divi’s Laboratories can effectively cater to the significant demand in the U.S. market, which is one of the largest consumers of pharmaceuticals globally. 
  • Divi’s Laboratories Europe AG: Based in Switzerland, Divi’s Laboratories Europe AG is instrumental in managing the company’s operations across Europe. This subsidiary handles the marketing, distribution, and regulatory compliance of Divi’s products within European markets. The subsidiary’s strategic location in Switzerland provides logistical advantages and facilitates better engagement with European clients and regulatory bodies. 
  • Divi’s Nutraceuticals: Divi’s Nutraceuticals is a specialized division dedicated to the production and marketing of Nutraceuticals ingredients, including a wide range of carotenoids and vitamins. Divi’s Nutraceuticals emphasizes research and development to innovate and expand its product offerings, aligning with consumer trends towards preventive healthcare and nutrition. 
  • Divi’s Research and Development Centers: While not traditional subsidiaries, Divi’s multiple R&D centers across India function as specialized units focusing on the development of new processes, technologies, and products. The R&D centers ensure that Divi’s Laboratories remains at the forefront of pharmaceutical innovation, maintaining its competitive edge in the global market. 
  • Divi’s Manufacturing Units: Divi’s Laboratories operates several manufacturing units in India, each functioning as a critical component of its production infrastructure. These units are located in Telangana and Andhra Pradesh and are equipped with state-of-the-art technology to produce a wide range of APIs and intermediates. The manufacturing units adhere to stringent quality standards and have received approvals from major regulatory agencies worldwide.  

Q3 FY25 Earnings 

  • Revenue of ₹2297 crore in Q3 FY25 up by 23.9% YoY from ₹1855 crore in Q3 FY24.  
  • EBITDA of ₹730 crore in this quarter at a margin of 32% compared to 26% in Q3 FY24. 
  • Profit of ₹594 crore in this quarter compared to a ₹358 crore profit in Q3 FY24. 

Financial Summary 

Amount in ₹ Cr Q3 FY24 Q3 FY25 FY23 FY24 
Revenue 1855 2297 7757 7845 
Expenses 1366 1649 5397 5635 
EBITDA 489 730 2370 2210 
OPM 26% 32% 31% 28% 
Other Income 95 82 344 335 
Net Profit 358 594 1824 1600 
NPM 19.3% 25.9% 23.5% 20.4% 
EPS 13.5 22.4 68.7 60.3 
Indian Oil Corporation Q3 FY25 Results
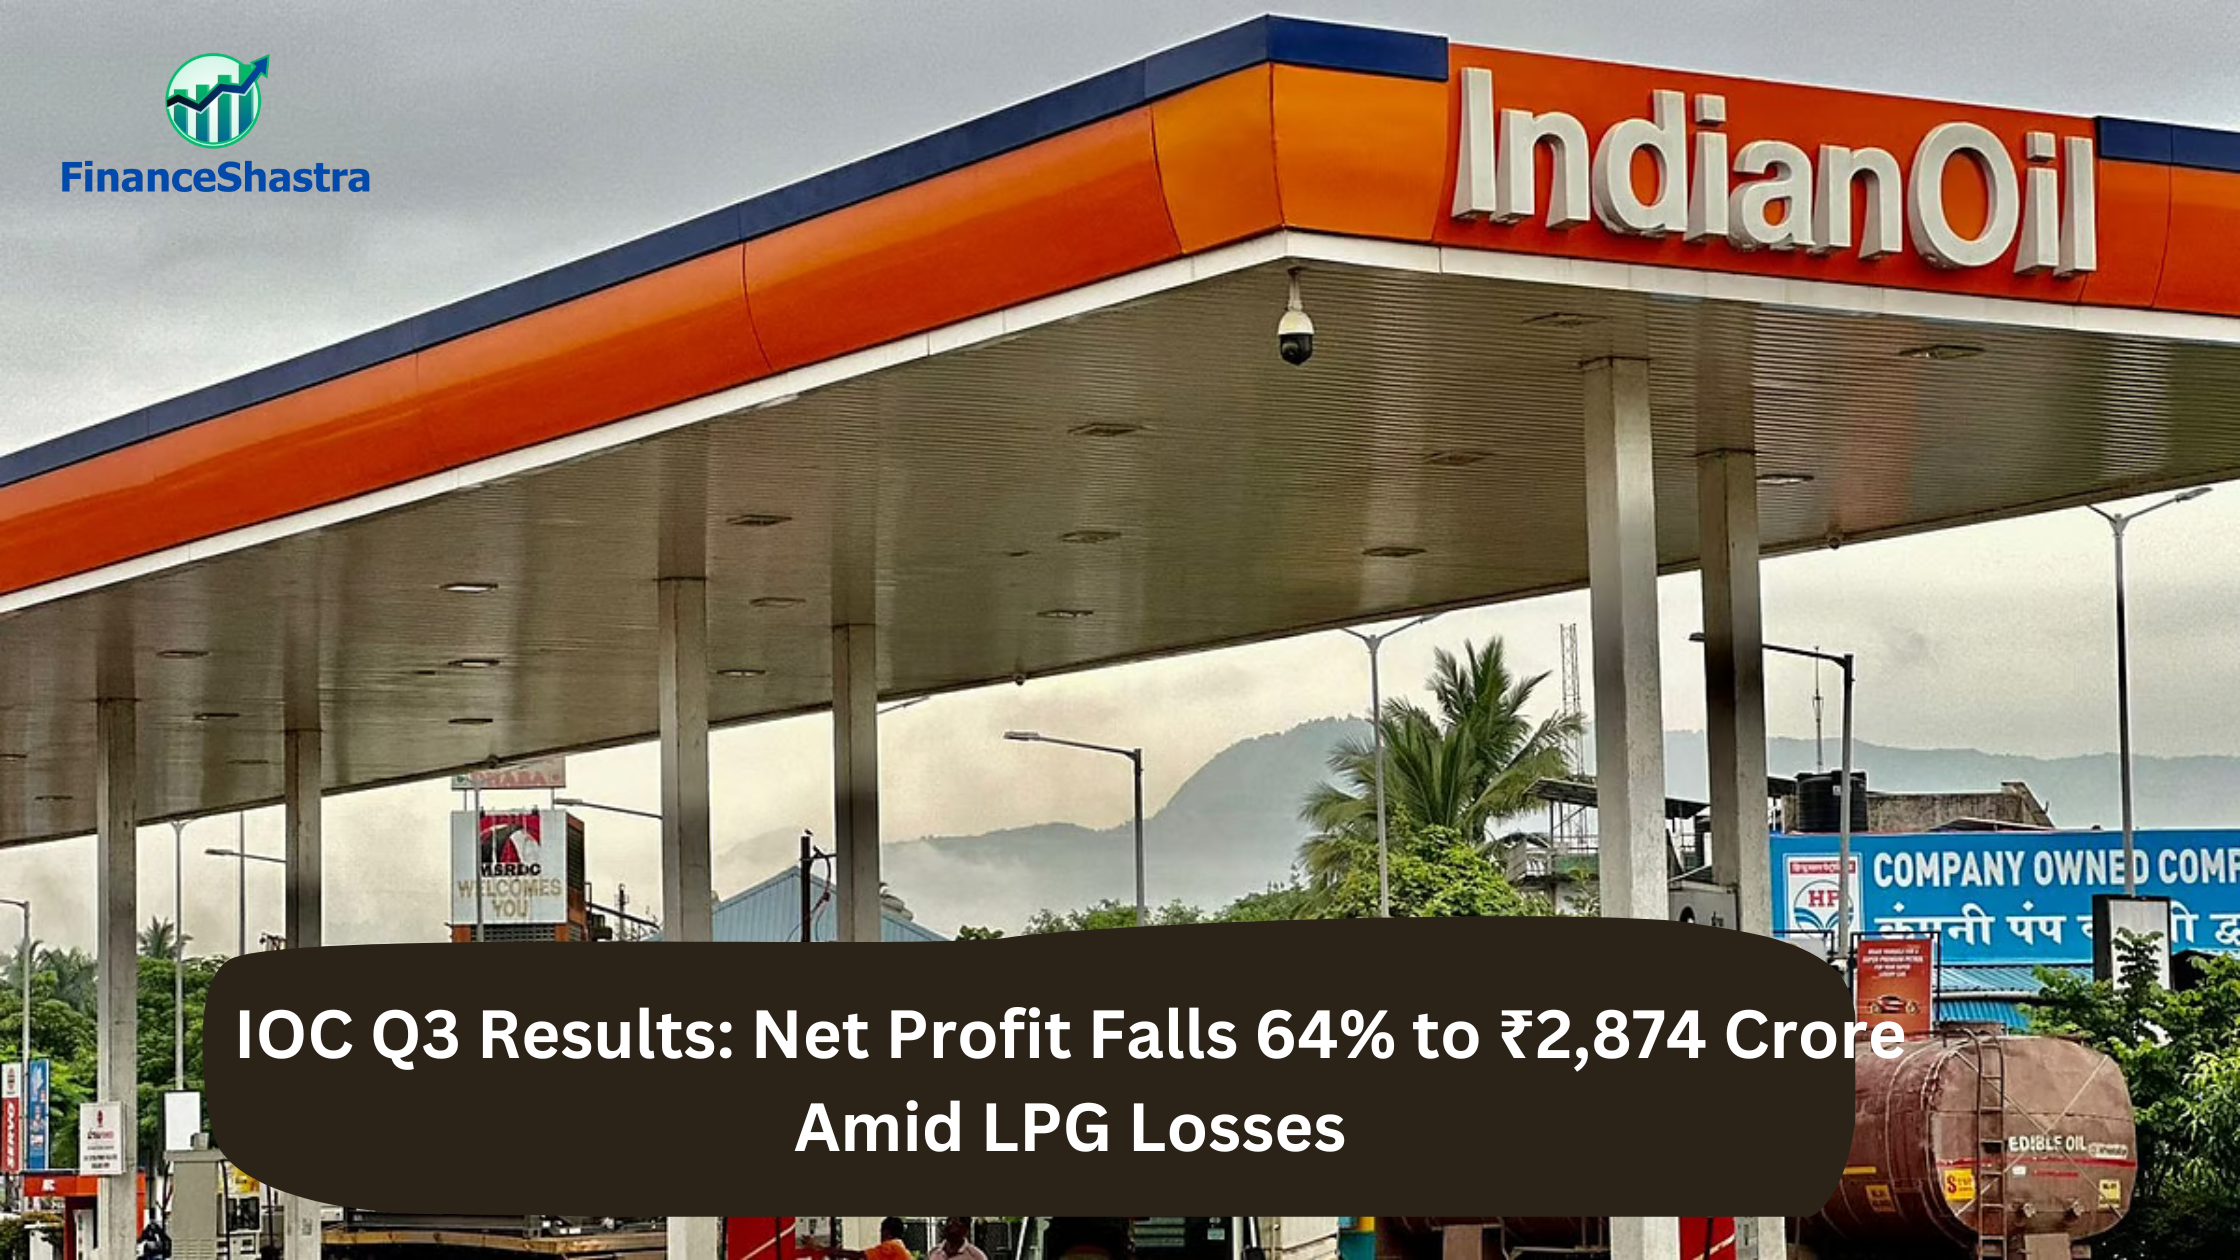
IOC Q3 Results: Net Profit Falls 64% to ₹2,874 Crore Amid LPG Losses

Indian Oil Corporation Ltd: Overview 

Indian Oil Corporation Ltd. (IOCL) is India’s largest integrated and diversified energy company, engaged in refining, pipeline transportation, petroleum product marketing, natural gas, petrochemicals, and alternative energy sources. The company operates the largest refining capacity in India, with a network of 11 refineries and a combined refining capacity of approximately 80.6 million metric tonnes per annum (MMTPA). IOCL plays a critical role in ensuring energy security for India by supplying fuel across sectors, including automotive, industrial, and aviation. IOCL has a vast pipeline infrastructure of over 17,000 km, transporting crude oil, refined petroleum products, and natural gas across the country. The company is also a major player in the retail fuel segment, with over 34,000 fuel stations and a strong presence in the liquefied petroleum gas (LPG) market. Additionally, IOCL is expanding its footprint in the petrochemical segment, renewable energy, and electric mobility, aligning with India’s sustainability goals. The Indian energy sector is witnessing a transformative shift due to rising fuel demand, advancements in refining technology, and a growing focus on clean energy. The country’s expanding economy and increasing urbanization are expected to drive fuel consumption in the coming years. According to industry estimates, India’s petroleum demand is projected to grow at a compound annual growth rate (CAGR) of around 4% over the next decade. With the government’s push for energy transition, IOCL is investing in biofuels, hydrogen, and electric vehicle charging infrastructure. The renewable energy sector, especially green hydrogen and biofuel blending, presents significant opportunities for IOCL. However, challenges such as global crude oil price volatility, regulatory changes, and competition from private refiners remain key risks for the company. 

Latest Stock News 

Operating margins are expected to recover significantly, with an improvement to 6.8% in the upcoming quarter compared to the 2.2% reported in Q2 FY25. The Gross Refining Margin (GRM) is projected to rise to $6.20 per barrel, marking a strong recovery from $1.60 per barrel in the previous quarter, although still lower than the $13.50 per barrel recorded in the same period last year. Crude throughput, which represents the volume of crude oil processed, is estimated to increase by 4% to 17.4 million metric tonnes (MMT), up from 16.7 MMT in Q2 FY25. Sales of petroleum products are also expected to show a modest increase of 1%, reaching 22.2 MMT compared to 21.9 MMT in the previous quarter, reflecting stable demand in the market. Investors should closely monitor key factors influencing the earnings performance. Strong margins in auto fuel marketing and refining operations may indicate a positive trend, but challenges persist, particularly in the petrochemical segment, where weak realizations and spreads continue to weigh on profitability. Additionally, higher inventory losses in liquefied petroleum gas (LPG) could negatively impact the company’s overall financial performance. During the second quarter, IOC faced several operational and financial challenges. Revenue declined by 9.8% to ₹1.74 lakh crore, missing market expectations. EBITDA suffered a sharp decline of 56.3%, reaching just ₹3,773 crore, while the operating margin dropped to 2.2%, significantly lower than the 4.5% reported in the previous quarter.  

Business Segments

  • Refining and Marketing: IOCL is the largest refiner in India, with 11 refineries producing various petroleum products, including petrol, diesel, kerosene, and aviation fuel. The company operates an extensive marketing network, including retail outlets, LPG distribution, and industrial fuel supply. IOCL has also introduced premium fuel products under the XP100 and XtraGreen brands. 
  • Pipelines: IOCL manages one of the world’s largest oil and gas pipeline networks, ensuring efficient transportation of crude oil, petroleum products, and natural gas. The company’s pipeline infrastructure enhances operational efficiency and reduces transportation costs. 
  • Petrochemicals: The petrochemicals division is a key growth area for IOCL, with products including polypropylene, polyethylene, and synthetic rubbers. The company has established large petrochemical plants, such as those at Panipat and Paradip, to cater to domestic and international markets. 
  • Natural Gas: IOCL is expanding its presence in the natural gas sector through city gas distribution (CGD), LNG imports, and pipeline-based natural gas supply. The company is a key player in India’s growing CGD network, aiming to support cleaner energy consumption. 
  • Alternative Energy and Sustainability Initiatives: IOCL is actively investing in green energy initiatives, including biofuels, hydrogen production, solar and wind energy, and electric vehicle (EV) charging infrastructure. The company is also exploring carbon capture technologies and sustainability-focused projects to reduce its environmental footprint. 

Subsidiary Information

  • Chennai Petroleum Corporation Ltd. (CPCL): Chennai Petroleum Corporation Ltd. (CPCL) is a significant refining subsidiary of Indian Oil Corporation Ltd. (IOCL), operating two refineries located in Tamil Nadu with a total refining capacity of 11.5 million metric tonnes per annum (MMTPA). The company plays a critical role in catering to the growing fuel demand of South India by ensuring a steady supply of petroleum products. 
  • Indian Oil LNG Pvt Ltd: Indian Oil LNG Pvt Ltd. is a key subsidiary focusing on the import, storage, and distribution of liquefied natural gas (LNG) to meet India’s growing energy needs. The company operates the Ennore LNG terminal, which is strategically located to provide a stable supply of LNG to various industries, power plants, and city gas distribution networks. 
  • Indian Oil Tanking Ltd: Indian Oil Tanking Ltd. is a joint venture between IOCL and Oiltanking GmbH, a global leader in petroleum storage logistics. This subsidiary specializes in handling, storing, and transporting petroleum products efficiently, ensuring seamless fuel distribution across the country. 
  • IndOil Montney Ltd: IndOil Montney Ltd. is an international subsidiary that focuses on the exploration, development, and production of oil and gas assets in Canada. This subsidiary helps expand IOCL’s global footprint in the energy sector by acquiring and managing valuable hydrocarbon reserves. 

Q3 FY25 Earnings 

  • Revenue of ₹194014 crore in Q3 FY25 down by 2.95% YoY from ₹199906 crore in Q3 FY24.  
  • EBITDA of ₹7573 crore in this quarter at a margin of 4% compared to 8% in Q3 FY24. 
  • Profit of ₹2147 crore in this quarter compared to a ₹9225 crore profit in Q3 FY24. 

Financial Summary 

Amount in ₹ Cr Q3 FY24 Q3 FY25 FY23 FY24 
Revenue 199906 194014 841756 776352 
Expenses 183172 186442 811073 700706 
EBITDA 16733 7573 30683 75636 
OPM 8% 4% 4% 10% 
Other Income 1916 1936 5124 5389 
Net Profit 9225 2147 11704 43161 
NPM 4.6% 1.1% 1.4% 5.6% 
EPS 6.4 1.5 6.9 29.6 
IndusInd Bank and Punjab National Bank Q3 FY25 Results
Q3 Results: IndusInd Bank Profit Drops 39% and Punjab National Bank Soars 103% YoY

IndusInd Bank Ltd: Overview 

IndusInd Bank Ltd. is a leading private sector bank in India, offering a diverse range of banking products and financial services to individuals, corporates, and SMEs. Established in 1994, the bank has grown into a strong player in retail, corporate, and wealth management segments, with a focus on digital banking and innovative financial solutions. It has a widespread presence with over 2,600 branches and 2,900+ ATMs across India, along with representative offices in key global financial hubs. The bank’s loan book is well-diversified, covering vehicle finance, microfinance, SME lending, and corporate banking. IndusInd Bank is known for its strong asset quality, stable deposit base, and focus on high-yield lending segments, driving consistent growth and profitability. The Indian banking sector remains on a growth trajectory, supported by economic expansion, increasing digital adoption, and rising credit demand. Private sector banks like IndusInd Bank are expected to benefit from a shift towards formal banking, financial inclusion initiatives, and a growing middle-class population. Key trends shaping the industry include the rise of fintech partnerships, growth in retail and SME lending, and enhanced regulatory frameworks ensuring financial stability. While challenges such as interest rate fluctuations, asset quality concerns, and global economic uncertainties persist, IndusInd Bank’s robust risk management, diversified loan portfolio, and digital-first approach position it well to navigate industry dynamics and capture long-term growth opportunities. 

Latest Stock News 

IndusInd Bank’s loan book stands at ₹366,889 crore, while deposits have reached ₹409,438 crore, demonstrating a well-diversified portfolio across products and geographies. The CASA ratio is at 35%, ensuring stable, low-cost deposits, and the loan mix is balanced at 54:46 between retail and wholesale lending. Key segments include microfinance (9%), gems & jewellery (3%), and vehicle finance (25%) of the total loan book. The bank maintains strong asset quality with a 70% Provision Coverage Ratio (PCR), Gross NPA at 2.25%, and Net NPA at 0.68%. Loan against property has grown 14% YoY to ₹11,986 crore, while the cost of deposits stands at 6.58% with a 3% QoQ increase. IndusInd Bank operates one of the largest treasury divisions among Indian banks, backed by best-in-class risk management systems. It has allocated a specific provision of ₹5,809 crore for non-performing accounts, floating provisions of ₹70 crore, and standard contingent provisions of ₹1,325 crore, with total loan-related provisions amounting to ₹8,792 crore (2.40% of total loans). The bank disburses over ₹200 crore in loans each month, acquires 70,000+ new clients monthly, and books fixed deposits worth ₹2,000 crore monthly. Leveraging advanced technology, IndusInd Bank employs 21+ machine learning-based propensity models and 70+ campaign triggers to drive cross-selling, bill payments, UPI mandates, and tier retention, ensuring continuous customer engagement and portfolio growth. 

Q3 FY25 Earnings 

  • Revenue of ₹12801 crore in Q3 FY25 up by 10.6% YoY from ₹11572 crore in Q3 FY24.  
  • Financing loss of ₹495 crore in this quarter at a margin of -4% compared to 6% in Q3 FY24. 
  • Profit of ₹1401 crore in this quarter compared to a ₹2298 crore profit in Q3 FY24. 

Punjab National Bank Ltd: Overview 

Punjab National Bank (PNB) is one of India’s largest public sector banks, offering a comprehensive range of banking and financial services. With a vast nationwide presence and a strong customer base, PNB provides retail and corporate banking solutions, including loans, deposits, treasury operations, and digital banking services. The bank maintains a well-diversified loan portfolio across sectors such as agriculture, MSMEs, corporate lending, and retail finance, ensuring balanced growth. Additionally, PNB continues to focus on asset quality improvement and digital transformation to enhance operational efficiency and customer experience. The Indian banking industry is witnessing steady credit growth, driven by economic recovery, increased demand for retail loans, and infrastructure development. Public sector banks, including PNB, are benefiting from government reforms, recapitalization measures, and digital banking adoption. However, challenges such as asset quality risks, regulatory changes, and interest rate fluctuations remain key factors to monitor. As the industry moves towards greater financial inclusion and technological advancements, PNB is strategically positioning itself to leverage these opportunities while strengthening its balance sheet and enhancing profitability. 

Latest Stock News 

Net Interest Income (NII) grew by 7.2% YoY. The bank’s asset quality improved, with Gross Non-Performing Assets (GNPA) declining to 4.09% (a 215 bps YoY reduction) and Net NPA falling to 0.41% (a 55 bps YoY decline). The Provision Coverage Ratio (PCR), including technical write-offs, stood at 96.77%, marking an improvement of 249 bps YoY. Credit cost showed a decline of 114 bps YoY, further strengthening the bank’s financial health. PNB’s agriculture priority sector (PS) advances reached 18.20% of Adjusted Net Bank Credit (ANBC), exceeding the regulatory norm of 18%. The bank also facilitated loan disbursement for the e-PM Vishwakarma scheme through the PNB Digital Rupee App, simplifying subsidy disbursement under the Subhadra Yojana. The bank operates internationally with branches in Dubai and Gift City, Gandhinagar, while its subsidiaries are located in London (UK) and Bhutan. Additionally, PNB has a joint venture in Nepal. The fee-based income for Q3 stood at ₹1,311 crore, contributing to overall revenue growth. PNB’s cost of deposits was 5.24%, lower than IndusInd Bank, while the yield on advances stood at 8.5%. The total GNPA ratio improved from 6.24% to 4.09% in the latest quarter, reflecting enhanced asset quality management. 

Q3 FY25 Earnings 

  • Revenue of ₹31895 crore in Q3 FY25 up by 14.5 % YoY from ₹27852 crore in Q3 FY24.  
  • Financing profit of ₹3663 crore in this quarter at a margin of 11% compared to 3% in Q3 FY24. 
  • Profit of ₹4811 crore in this quarter compared to a ₹2441 crore profit in Q3 FY24. 
Sun Pharma Q3 FY25 Results
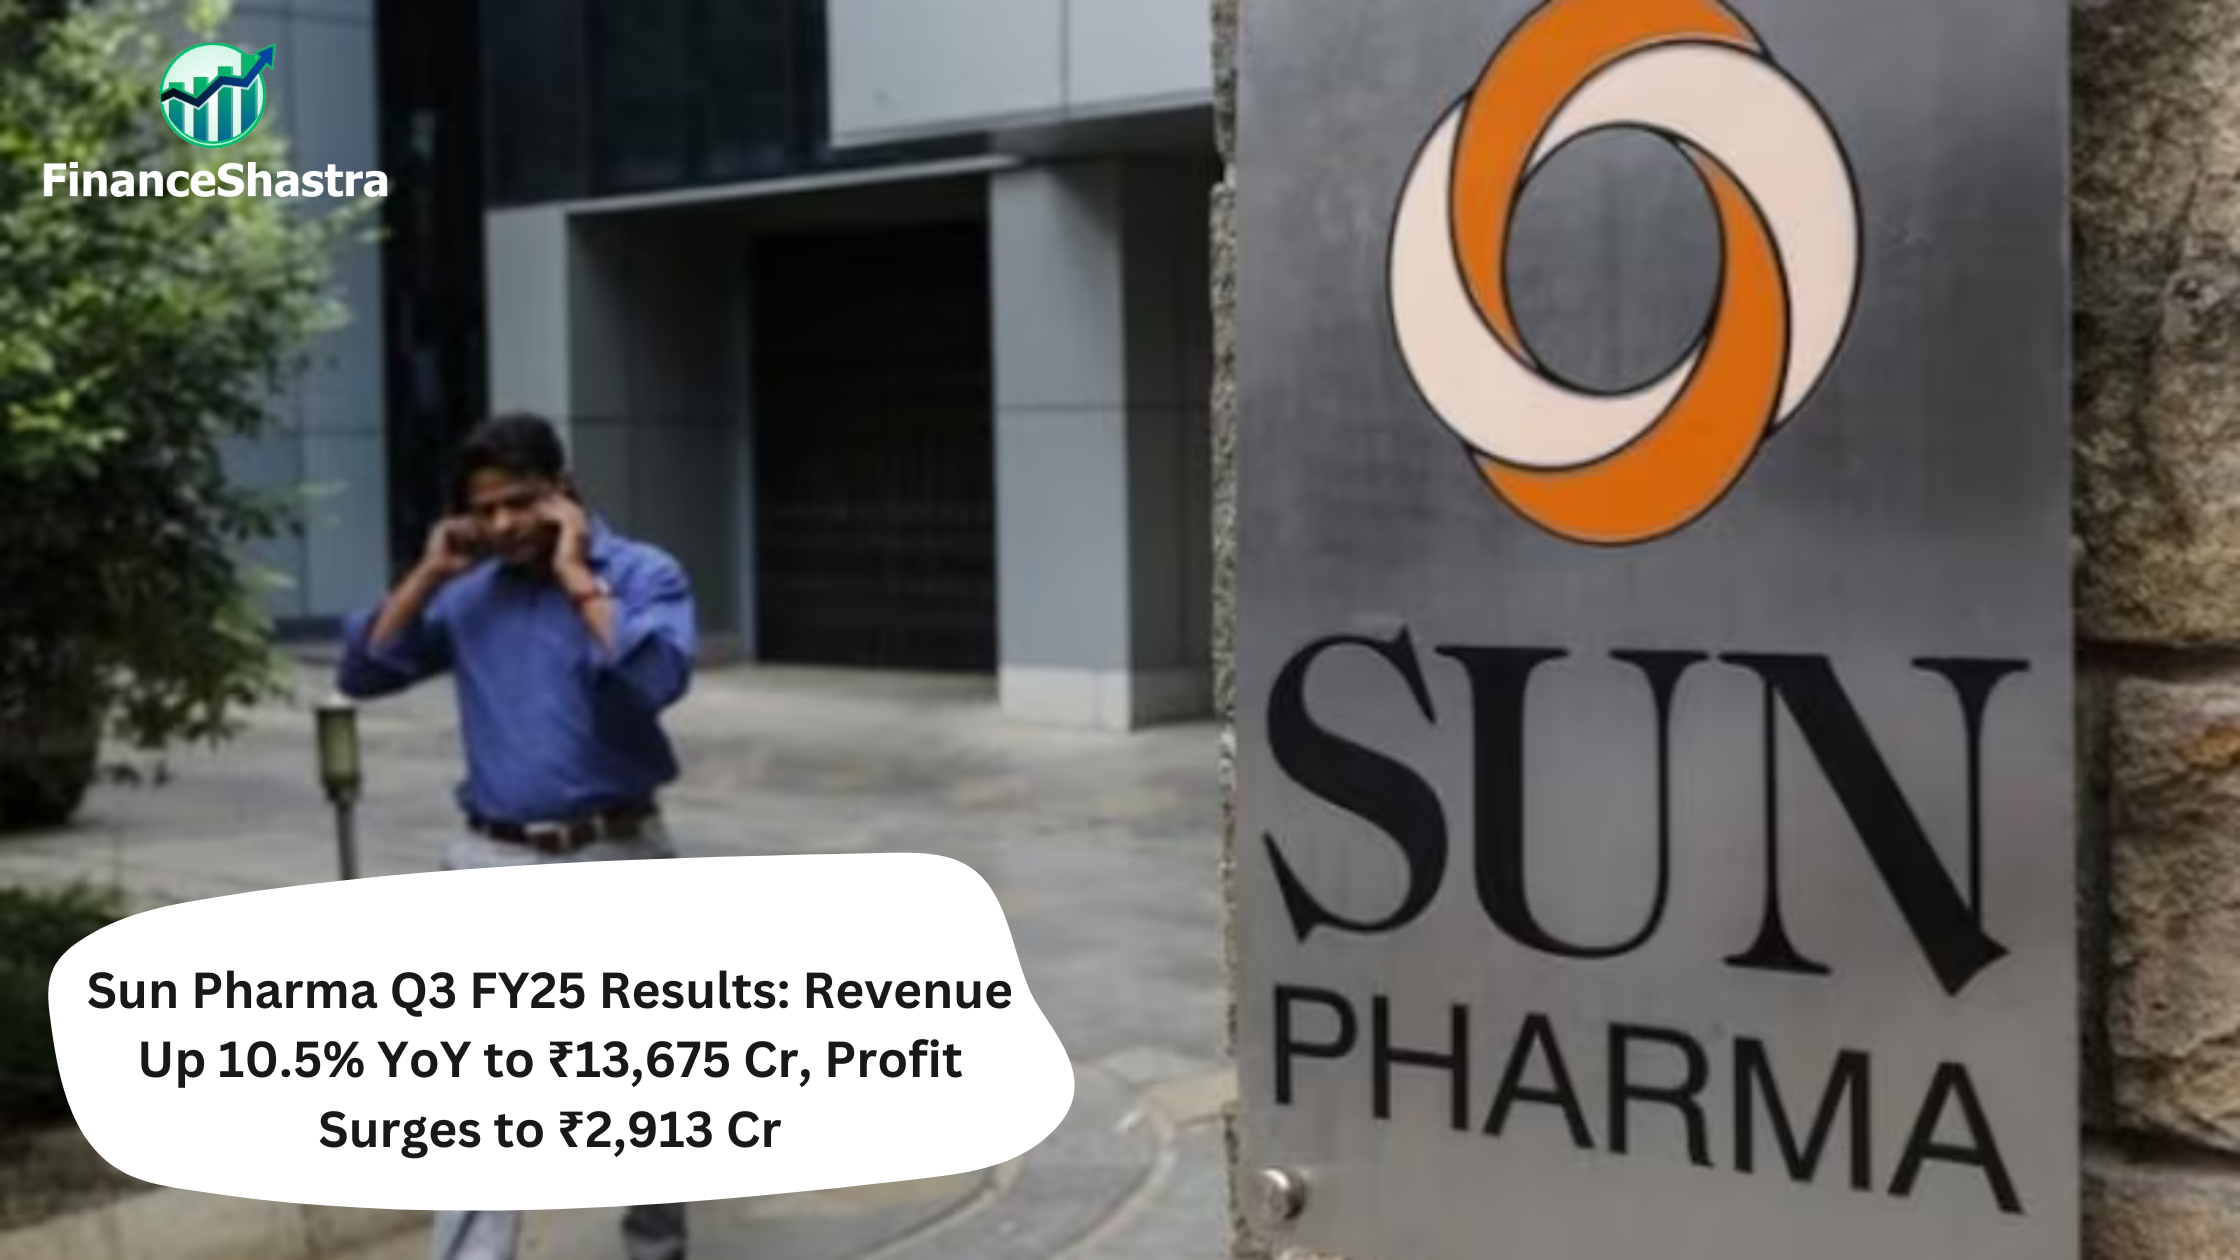
Sun Pharma Q3 FY25 Results: Revenue Up 10.5% YoY to ₹13,675 Cr, Profit Surges to ₹2,913 Cr

Sun Pharmaceuticals Industries Ltd: Overview 

Sun Pharmaceutical Industries Ltd. is the largest pharmaceutical company in India and one of the leading specialty generic drug manufacturers globally. It operates across over 100 markets, with a strong presence in the U.S., India, Emerging Markets, and Western Europe. The company and its subsidiaries has various manufacturing facilities spread across the world with trading and other incidental and related activities extending to global market. The company’s product portfolio includes branded generics, complex generics, active pharmaceutical ingredients (APIs), and specialty drugs, particularly in dermatology, ophthalmology, and oncology. With an extensive R&D focus, Sun Pharma has consistently expanded its specialty drug pipeline, leveraging both organic growth and strategic acquisitions. It produces a comprehensive and diverse portfolio of generic and specialty medicines targeting wide spectrum of chronic and acute treatments. The global pharmaceutical industry is experiencing strong growth driven by rising healthcare expenditures, increased chronic disease prevalence, and higher demand for specialty medications. India remains a key player in the global generic drug industry, supplying over 20% of global generics by volume. Additionally, Sun Pharma is capitalizing on regulatory approvals, biosimilars opportunities, and increased focus on high-margin specialty drugs, positioning itself for sustainable long-term growth. 

Latest Stock News 

India’s formulation sales reached ₹43,004 million, marking a 13.8% increase. US formulation sales were USD 474 million, showing a slight decline of 0.7%. Global Specialty sales amounted to USD 370 million, which includes USD 45 million in milestone revenues. Excluding these milestones, Global Specialty sales grew by 17.5%. These sales, excluding milestones, represented 21% of total Q3FY25 sales. Formulation sales in emerging markets reached USD 277 million, up 10.1%, while sales in the rest of the world rose by 21% to USD 259 million. The company’s R&D investments for the quarter stood at ₹8,450 million, up from ₹8,245 million in Q3FY24. According to the SMSRC (July-Oct 2024) report, the company is ranked No.1 by prescriptions across 12 doctor categories. In Q3FY25, the company launched 12 new products in the Indian market. In the US, formulation sales were USD 474 million for Q3FY25, down 0.7% compared to the same quarter last year, accounting for about 30% of the total consolidated sales. For the first nine months of the fiscal year, sales amounted to USD 1,457 million, reflecting a 5.7% increase. The R&D pipeline includes 7 novel entities undergoing clinical trials. The company offers a comprehensive product portfolio in the US market, with approved ANDAs for 541 products and 109 ANDAs pending US FDA approval, including 28 tentative approvals. Additionally, there are 51 approved NDAs, with 13 NDAs awaiting US FDA approval. During the quarter, 6 ANDA filings were made, and 2 ANDA approvals were received. Upcoming developments include Phase 3 topline data for Ilumya in psoriatic arthritis expected in H2CY25, and the approval of Leqselvi for severe alopecia areata in the US. 

Business Segments

  • India Business: Contributing around 32% of total revenue, Sun Pharma is the largest pharmaceutical company in India with a robust branded generics portfolio, covering therapies such as cardiology, dermatology, ophthalmology, and diabetes. The company continues to launch innovative first-to-market formulations and expand its domestic reach. 
  • U.S. Business: The largest revenue contributor, accounting for approximately 30% of total sales. Sun Pharma has a strong pipeline of complex generics, specialty drugs, and biosimilars, with key brands including Ilumya (psoriasis), Cequa (dry eye), and Odomzo (skin cancer). The U.S. generics market remains competitive, but Sun Pharma’s differentiated portfolio provides an edge. 
  • Emerging Markets (EM): This segment contributes around 18% of revenue, covering Asia, Latin America, and Russia/CIS regions. Sun Pharma continues to strengthen its branded generics presence, leveraging its local partnerships, strong distribution network, and diversified product pipeline. 
  • Rest of the World (ROW): Comprising markets in Western Europe, Canada, and Australia, this segment contributes nearly 14% of revenue. The company focuses on branded generics and specialty drug launches in key developed markets. 
  • Active Pharmaceutical Ingredients (APIs): A crucial segment, supplying APIs both internally for formulations and externally to third parties. Sun Pharma’s API business provides a competitive cost advantage, backed by state-of-the-art manufacturing and backward integration. 

Subsidiary Information

  • Taro Pharmaceuticals: Taro Pharmaceuticals is a key subsidiary of Sun Pharma, operating across the United States, Canada, and Israel, with a strong focus on dermatology and niche generic drugs. The company has established itself as a leader in the development and manufacturing of topical formulations, which include creams, ointments, and gels used in the treatment of various skin conditions. Taro’s specialization in dermatology has allowed it to build a robust portfolio of high-margin specialty products. 
  • Ranbaxy Laboratories: Sun Pharma acquired Ranbaxy Laboratories in 2015, a strategic move that significantly strengthened its global generics portfolio. Ranbaxy had a well-established presence in India and Emerging Markets, bringing with it an extensive product range and a wide distribution network. The integration of Ranbaxy into Sun Pharma’s operations led to substantial improvements in research and development (R&D) capabilities, enabling the company to develop and launch high-quality, affordable generic medicines across multiple geographies. 
  • Poland’s Polpharma: Polpharma, a leading pharmaceutical company based in Eastern Europe, plays a crucial role in strengthening Sun Pharma’s position in the CIS (Commonwealth of Independent States) and European branded generics market. With a strong focus on branded generics, Polpharma provides Sun Pharma with access to an extensive product portfolio and a well-established distribution network across multiple European countries. 
  • Dusa Pharmaceuticals: Dusa Pharmaceuticals is a specialized subsidiary that focuses on photodynamic therapy (PDT) for dermatological treatments, reinforcing Sun Pharma’s position in the high-value specialty pharmaceutical segment. Dusa’s innovative light-activated drug treatments are widely used for various skin-related disorders, offering patients advanced therapeutic options.  
  • Sun Pharma Advanced Research Company (SPARC): Sun Pharma Advanced Research Company (SPARC) serves as the dedicated research and development (R&D) arm of Sun Pharma, focusing on new drug discovery, innovative drug delivery systems, and specialty pharmaceuticals. By continuously investing in cutting-edge research, SPARC enhances Sun Pharma’s long-term growth strategy, reinforcing its position as a global leader in the pharmaceutical industry. 

Q3 FY25 Earnings 

  • Revenue of ₹13675 crore in Q3 FY25 up by 10.5% YoY from ₹12381 crore in Q3 FY24.  
  • EBITDA of ₹4009 crore in this quarter at a margin of 29% compared to 28% in Q3 FY24. 
  • Profit of ₹2913 crore in this quarter compared to a ₹2516 crore profit in Q3 FY24. 

Financial Summary 

Amount in ₹ Cr Q3 FY24 Q3 FY25 FY23 FY24 
Revenue 12381 13675 43886 48497 
Expenses 8904 9666 32235 35479 
EBITDA 3477 4009 11650 13018 
OPM 28% 29% 27% 27% 
Other Income 180 149 459 865 
Net Profit 2561 2913 8513 9610 
NPM 20.6% 21.3% 19.4% 19.8% 
EPS 10.5 12.1 35.3 39.9 
Nestle India Q3 FY25 Results
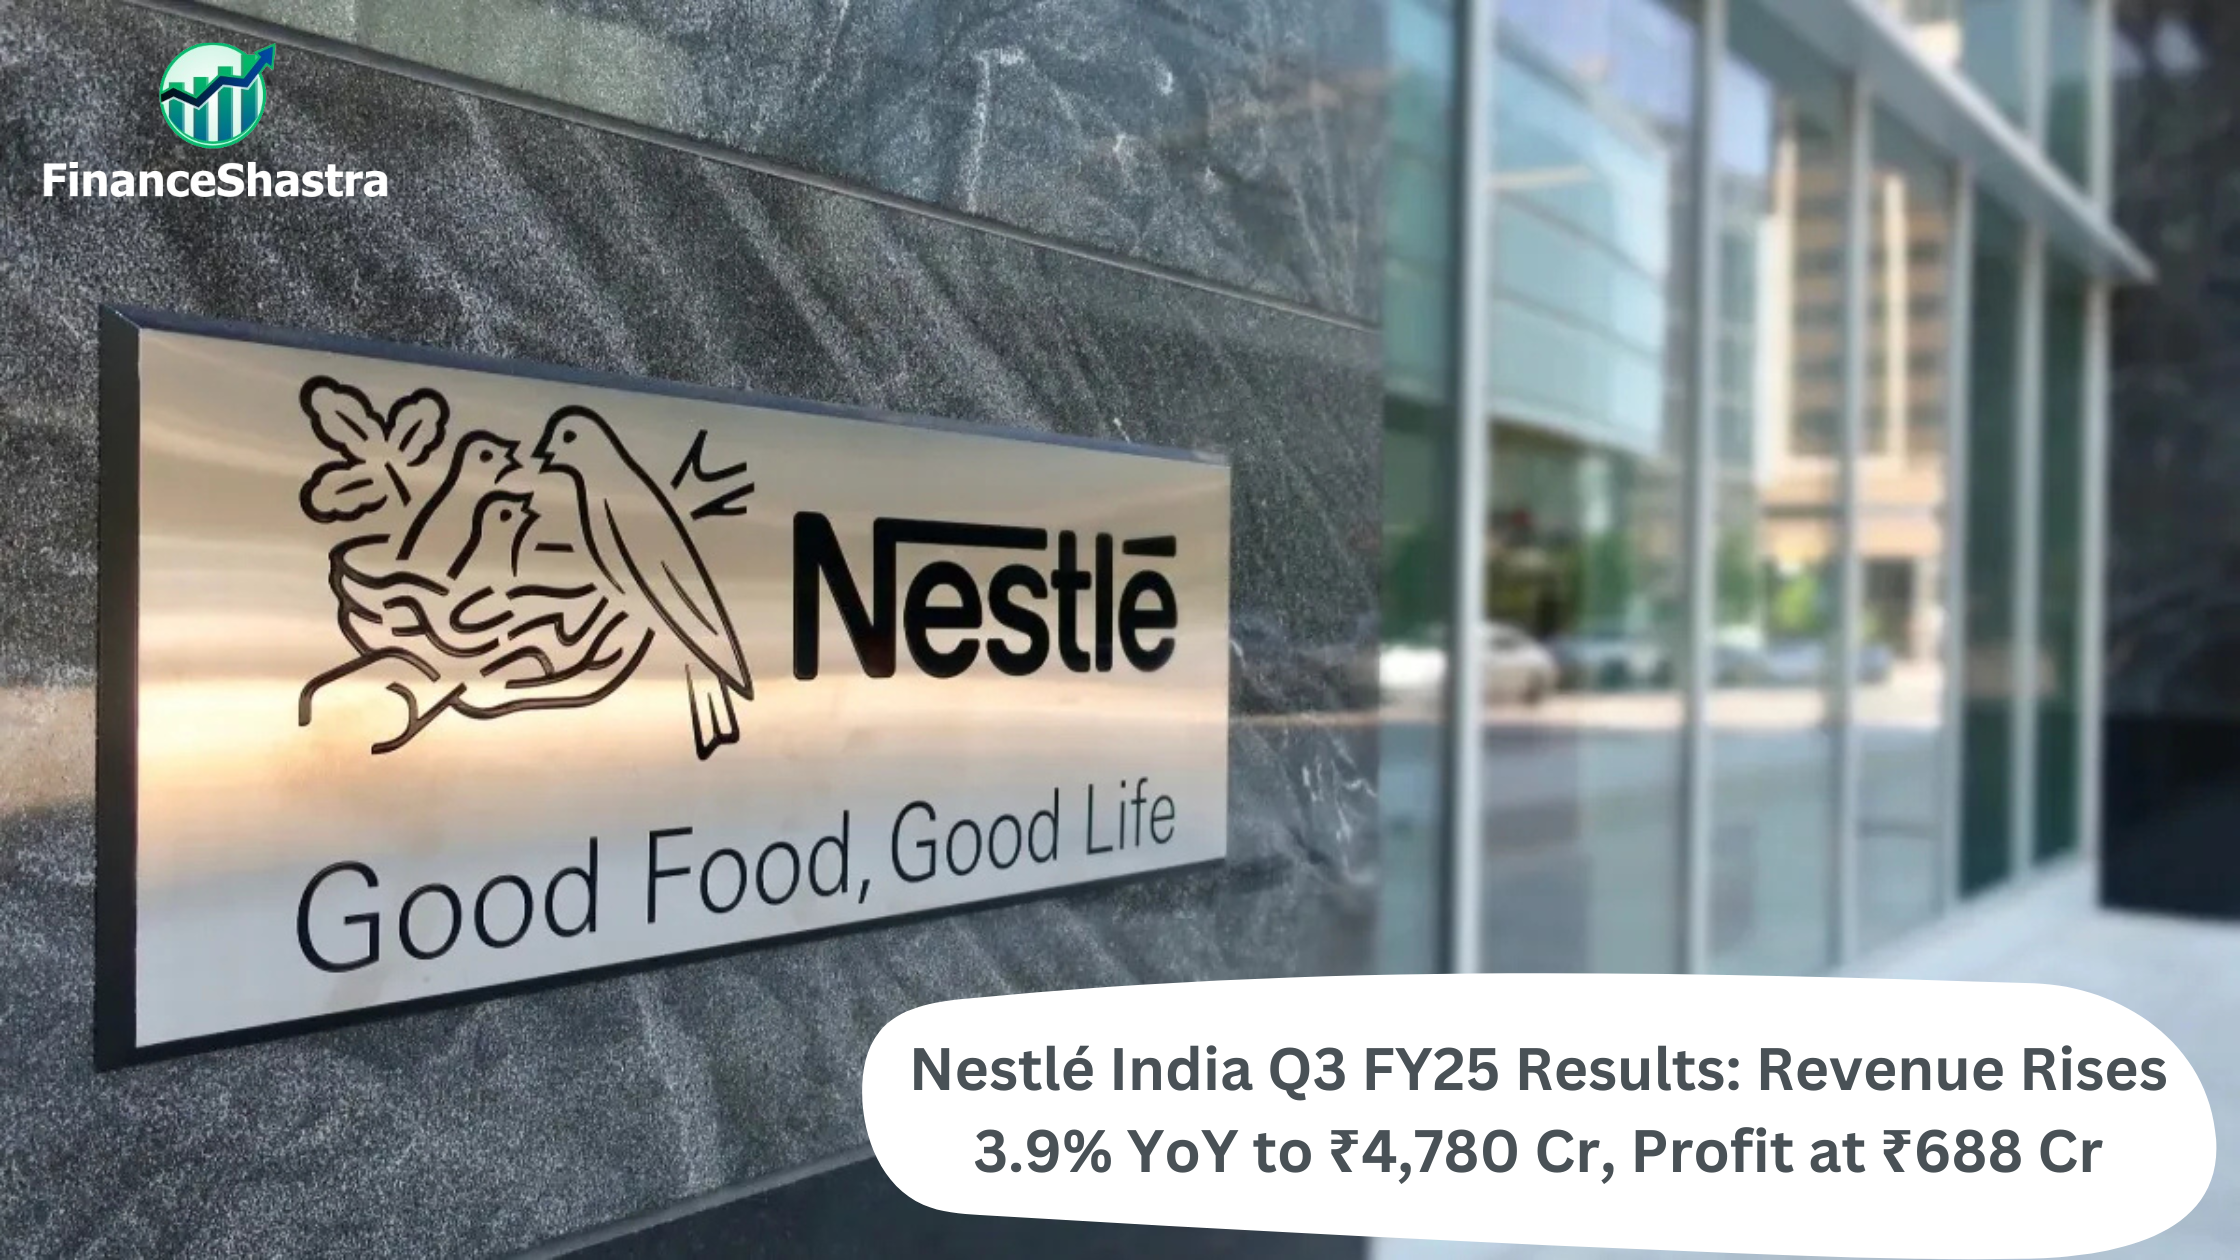
Nestlé India Q3 FY25 Results: Revenue Rises 3.9% YoY to ₹4,780 Cr, Profit at ₹688 Cr

Nestle India Ltd: Overview 

Nestle India Limited, a subsidiary of the Swiss multinational Nestle S.A., is one of the leading FMCG companies in India, specializing in nutrition, health, and wellness products. With a presence spanning over six decades, Nestle India has become synonymous with quality and innovation in the Indian food and beverage industry. The company operates in various product categories, including dairy, confectionery, beverages, instant foods, and infant nutrition, with some of the most recognized brands like Maggi, Nescafe, KitKat, and Cerelac. Nestle India’s extensive distribution network ensures that its products are widely available across urban and rural markets, supported by continuous investments in research, development, and local manufacturing. The company focuses on sustainable growth, innovation in nutritional science, and digital transformation to enhance consumer experience, making it a dominant player in the Indian FMCG sector. The Indian food and beverage industry is poised for robust growth, driven by rising disposable incomes, urbanization, and increasing health consciousness among consumers. The industry is expected to expand due to growing demand for packaged and ready-to-eat foods, fortified nutrition products, and plant-based alternatives. The e-commerce and digital retail boom further strengthens Nestle India’s market position, allowing it to reach a broader consumer base. Moreover, the Indian government’s emphasis on food safety regulations, nutrition awareness programs, and sustainable manufacturing practices aligns with Nestle’s long-term business strategy. The sector faces challenges such as raw material price volatility, changing consumer preferences, and regulatory complexities, but Nestle India continues to innovate with new product launches and sustainable packaging solutions. 

Latest Stock News 

In the third quarter, three out of four product groups demonstrated strong growth, driven by a combination of pricing and volume expansion. Key brands continued to perform well, which is encouraging despite the challenging market environment. Nestle’s powdered and liquid beverages segment was the largest growth driver, achieving high double-digit growth. Notably, the beverages retail segment surpassed ₹2000 crore, in revenue over the last twelve months, marking a significant milestone. The Out-of-Home business also reported strong double-digit growth, particularly in the food and beverage solutions portfolio. E-commerce maintained its rapid growth trajectory, posting high double-digit growth and contributing 9.1% to domestic sales. Additionally, new product launches since 2015 now account for approximately 7% of the company’s total sales. 

This quarter was characterized by food inflation, a slowdown in urban consumption, and a gradual recovery in rural markets. Revenue is projected to grow by 4%, supported by a 2% increase in volume and price hikes. However, EBITDA margins are expected to decline by 189 basis points year-over-year to 22%, largely due to weaker gross margin performance. Key factors to monitor include the demand outlook in rural versus urban markets, competitive intensity, and raw material price trends. Nestle has also expanded its manufacturing capacity with a new production line for KitKat in Gujarat, which will have an annual capacity of 15,000 tons. The estimated capital expenditure for this unit is around ₹1,100 crore, which will be fully funded through internal accruals without the need for external borrowing. 

Business Segments

  • Prepared Dishes & Cooking Aids: This segment includes the flagship Maggi brand, which dominates the instant noodles and ready-to-cook meals category in India. Nestle India continues to innovate within this segment by introducing healthier variants, fortified products, and expanding its range of pasta, soups, and seasonings. 
  • Milk Products & Nutrition: This segment covers dairy-based products such as Nestle Milk, Every day, Nestle Slim Milk, and Cerelac, catering to consumers of all age groups. The company focuses on enhancing nutritional value, affordability, and sustainability in its dairy offerings, with an increasing shift towards fortified and protein-rich products. 
  • Beverages: Nestle India holds a strong market share in the beverages segment with brands like Nescafe, Nestea, and Milo. The rising demand for premium and instant coffee products, along with increasing consumer preference for healthy and functional beverages, has led to further innovations in this segment. 
  • Chocolate & Confectionery: Nestle’s stronghold in the confectionery segment includes globally popular brands like KitKat and Munch. The segment benefits from premiumization trends and increasing chocolate consumption in India, with the introduction of innovative flavours, formats, and healthier alternatives. 
  • Infant Nutrition: With brands like Lactogen and Nan Pro, Nestle India is a leading player in the infant nutrition market. The company focuses on providing scientifically advanced, safe, and highly nutritious products to support early-stage child development. 

Subsidiary Information

  • Nestle R&D Centre India Pvt Ltd: This subsidiary plays a crucial role in Nestle’s innovation pipeline, focusing on product development, quality enhancement, and customization for the Indian market. The R&D center collaborates with local agricultural and nutrition experts to ensure that Nestle India stays ahead in terms of product relevance and nutritional advancements. 
  • Nestle India Beverages Pvt Ltd: This subsidiary manages Nestle India’s beverage portfolio, primarily overseeing the Nescafe brand and its expansions into instant coffee, cold brews, and functional drinks. Given the rising demand for ready-to-drink and plant-based beverages, this division focuses on continuous innovation and premiumization. 
  • Nestle Nutrition India Pvt Ltd: Dedicated to infant and maternal nutrition, this subsidiary oversees the production, marketing, and distribution of brands like Cerelac, Lactogen, and Nan Pro. It is committed to scientific research in early nutrition, aiming to provide high-quality, fortified, and safe nutrition products for Indian consumers. 
  • Nestle Waters India Pvt Ltd: This subsidiary handles Nestle’s bottled water business, catering to the growing demand for premium and packaged drinking water solutions. While still a niche segment, Nestle Waters India is expanding into sustainable and functional hydration solutions, including flavoured and vitamin-enhanced waters. 
  • Nestle India Services Pvt Ltd: This subsidiary focuses on supply chain, logistics, and customer service operations, ensuring smooth production and efficient market distribution. It plays a vital role in digitizing Nestle India’s supply chain, reducing costs, and enhancing product availability across urban and rural markets. 

Q3 FY25 Earnings 

  • Revenue of ₹4780 crore in Q3 FY25 up by 3.9% YoY from ₹4600 crore in Q3 FY24.  
  • EBITDA of ₹1077 crore in this quarter at a margin of 23% compared to 24% in Q3 FY24. 
  • Profit of ₹688 crore in this quarter compared to a ₹656 crore profit in Q3 FY24. 

Financial Summary 

Amount in ₹ Cr Q3 FY24 Q3 FY25 CY23 FY24 
Revenue 4600 4780 19126 24394 
Expenses 3505 3703 14655 18581 
EBITDA 1095 1077 4471 5813 
OPM 24% 23% 23% 24% 
Other Income -77 116 159 
Net Profit 656 688 2999 3933 
NPM 14.3% 14.4% 15.7% 16.1% 
EPS 6.8 7.1 31.1 40.8