Why Adani Wilmar Shares Plunged
Why Adani Wilmar Shares Plunged: Key Reasons Behind the 9.2% Drop and Stake Sale Impact

Adani Wilmar Ltd. fell sharply 9.2% on the last trading day (Friday) to a one-day low of ₹291 on NSE. The fall came after one of its promoters, Adani Commodities LLP, announced a sale of up to 20% holding. The company submitted an offer (OFS) in this month (January 2025).

Strategic transformation by Adani Group

The share sale is in line with Adani Group’s broader strategy to exit non-core businesses. and focus on core infrastructure businesses including airports, roads, data centers, and green hydrogen. Sales generated a revenue of approximately Rs. 485 Cr., among these key activities. It will be a repeat investment.

Parent company Adani Enterprises plans to phase out Adani Wilmar. In the first phase, 13.5% of the shares will be sold through OFS, while in the second phase, Singapore’s Wilmar International Ltd will acquire the remaining shares at a price not exceeding ₹305 per share.

Impact on the market and shareholder changes

OFS has attracted huge interest from over 100 domestic and international investors, making it one of the largest OFS transactions in the recent history of the Indian capital market. The sale announcement, coupled with pressure in the broader market, sent shares of Adani Wilmar down 10% in price.

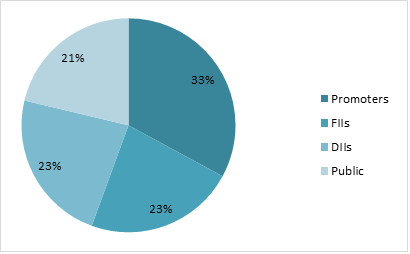
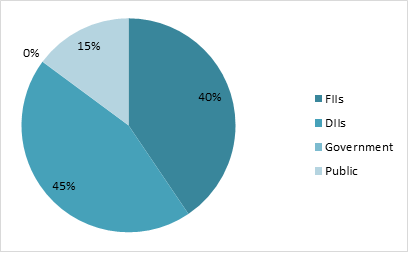
Investor structure after OFS: Adani Group’s stake in the joint venture decreased from 43.94% to 31.06% after the transaction, while Wilmar International It is set to purchase the remaining shares by March 2025.

Compliance and Finance

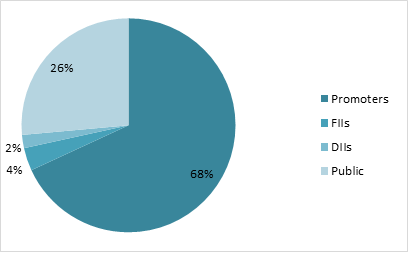
The sale of Adani Wilmar’s shares ensures compliance with Sebi’s minimum public shareholding (MPS) norms, which require public ownership of at least 25% in a listed entity. After OFS, public shareholders hold shares at 25.63%, while promoters hold 74.37% of the shares.

Business overview and growth trends

Adani Wilmar, an equal joint venture between Adani Group and Wilmar International, dominates the Indian FMCG sector with its flagship brand Fortune, which produces cooking oil, wheat flour, rice, and sugar. The company posted consolidated revenue of Rs 51,555 crore last fiscal year as on date. At the last update, it also reported a market capitalization of ₹42,000 crore.

IREDA Driving India’s Renewable Energy Revolution
IREDA: Driving India’s Renewable Energy Revolution with Innovative Financing and Record Growth in Q3 FY25

IREDA Ltd: Overview 

Incorporated in 1987, Indian Renewable Energy Development Agency Ltd. (IREDA) is a Government of India enterprise operating under the Ministry of New and Renewable Energy (MNRE). It is a public financial institution primarily focused on promoting, developing, and financing renewable energy and energy efficiency projects across India. As a specialized institution, IREDA plays a pivotal role in India’s transition towards a sustainable and low-carbon economy by supporting the government’s renewable energy initiatives. IREDA has been instrumental in financing a significant portion of India’s renewable energy capacity, supporting the country’s ambition of achieving 500 GW of non-fossil fuel capacity by 2030.  India’s renewable energy sector is poised for exponential growth, driven by ambitious government targets, favourable policies, and technological advancements. With the push for green hydrogen, offshore wind projects, and large-scale solar parks, IREDA is positioned to play a critical role in financing and driving the nation’s green energy transformation. Its expertise and robust financial strategies make it a key player in India’s journey towards sustainable energy leadership. 

Business Segments:

  • Renewable Energy Financing: It provides financing to large-scale solar photovoltaic (PV) power plants, rooftop solar projects, and solar thermal systems. Supporting initiatives to generate energy from agricultural waste, municipal solid waste, and other biomass resources. Major segments were Solar Energy, Wind Energy Projects, Biomass Projects, Hydro Power projects, etc. 
  • Innovative Financing Solutions: It is a way of financing through issuing green bonds to raise funds for renewable energy projects, attracting both domestic and international investors, offering refinancing options for operational renewable energy projects to optimize capital structures or short-term funding solutions for projects awaiting long-term financing or subsidies from government schemes. 

Subsidiary Information:

  • IREDA Global Green Energy Finance IFSC Ltd: It is a wholly owned subsidiary operates from GIFT city Gandhinagar, Gujarat. Its mission is to provide finance and promote renewable energy projects, domestically and internationally, aligning with IREDA’s vision of expanding sustainable energy solutions. This entity is designed to manage retail business under schemes like PM-Suryaghar (Rooftop Solar) and PM-KUSUM, as well as B2C segments in renewable energy and emerging sectors, including electric vehicles, energy storage, green technologies, sustainability, and energy efficiency. 

Q3 FY25 & Business Highlights 

  • Revenue of ₹1698 crore in Q3 FY25 up by 35% YoY from ₹1253 crore in Q3 FY24.  
  • EBITDA of ₹548 crore in this quarter at a margin of 32% compared to 31% in Q3 FY24. 
  • Profit of ₹425 crore in this quarter compared to a ₹336 crore profit in Q3 FY24. 
  • IREDA signed MoU with SJVN and GMR for 900MW Hydropower Project in Nepal. 
  • Incorporation of IREDA Global Green Energy Finance IFSC Limited, a wholly owned subsidiary in GIFT City Gandhinagar for Foreign currency financing. 
  • The Renewable capacity of IREDA was 125GW in FY19 which has increased to 206GW in FY25, with highest share of solar power in capacity. 
  • The gross yield on loan assets has come to 9.96% and the cost of borrowing at 7.68%, which creates interest spread of 2.28%. 
  • The sector wise loan disbursement as on 31 December is majorly 26% solar, 15% wind, 12% hydro power18% loan facility to state utilities. 

Financial Summary 

INR Cr. Q3 FY24 Q3 FY25 FY23 FY24 
Revenue 1253 1698 3483 4965 
Expenses 760 1032 2088 3164 
EBITDA 394 548 1163 1716 
OPM 31.0% 32.0% 33.0% 35.0% 
Net Profit 336 425 865 1252 
NPM 26.8% 25.0% 24.8% 25.2% 
EPS 1.25 1.58 3.78 4.66 
Aegis Logistics Ltd: Accelerating Growth in India
Aegis Logistics Ltd: Accelerating Growth in India’s Liquid and Gas Logistics with 25% CAGR

Aegis Logistics Limited: Overview 

Aegis Logistics Ltd. is a leading integrated logistics company in India, specializing in the handling and storage of liquid, gas, and chemical products. Established in 1956, the company operates through two key business segments: Liquid Terminal Division and Gas Terminal Division. These divisions provide end-to-end supply chain solutions for its clients, including storage, distribution, and terminal services. It has two business segments Liquid and Gas Terminal Division, where it provides services such as gas bottling, bulk LPG distribution, and retail operations through partnerships with oil marketing companies. Aegis Logistics has built a robust infrastructure, including state-of-the-art terminals, pipelines, and distribution facilities. The company has leveraged its strategic locations near major consumption centers to cater to the needs of large industrial and retail clients. 

Latest Stock News (9 Jan 2025) 

Aegis Logistics’ share price also rallied driven by recent government directives aimed at strengthening the natural gas sector. On 31 December 2024, a circular was issued by the Ministry of Petroleum and Natural Gas. The circular mandates key changes that directly benefit city gas distribution (CGD) companies, indirectly influencing investor sentiment toward the stock. The GAIL India cannot reduce natural gas allocations to CGD companies without prior approval from the Ministry of Petroleum and Natural Gas. The company is targeting a 25% compound annual growth rate (CAGR) by FY27. With approximately half of its Rs 45 billion (bn) capital expenditure program already completed or underway, it’s on track to meet its growth objectives. 

Shareholding Pattern as on September 2024 

Key Stats 

Market Cap ₹29133 Crore 
Revenue ₹7062 Crore 
Profit ₹583 Crore 
ROCE 14.7% 
P/E 49.9 

Peer Comparison 

Amt in ₹ Cr MCap Sales PAT ROCE Asset Turn. EV/EBITDA D/E P/E 
Aegis Logistics 29133 7062 583 14.7% 0.94 26.47 1.06 49.9 
Adani Total Gas 74925 4687 702 21.2% 0.73 61.5 0.37 106.7 
Gujarat Gas 33459 16295 1225 20.5% 1.39 14.6 0.02 27.3 
Petronet LNG 48052 54977 3917 26.4% 2.22 6.5 0.15 12.3 
GAIL 118075 136080 11534 14.6% 1.15 6.87 0.23 10.2 

Financial Trends 

Amount in ₹ Cr 2020 2021 2022 2023 2024 
Revenue 7183 3843 4631 8627 7046 
Expenses 6906 3456 4096 7955 6123 
EBITDA 277 388 535 672 923 
OPM 4% 10% 12% 8% 13% 
Other Income 33 37 39 187 190 
Net Profit 134 249 385 511 672 
NPM 1.87% 6% 8% 6% 10% 
EPS 2.93 6.36 10.19 13.2 16.22 

Stock Price Analysis 

In terms of performance, Aegis Logistics has shown a return of -6.48% in one day, 5.81% over the past month, and 20.07% in the last three months. Over the past 52 weeks, the shares have seen a low of ₹354.15 and a high of ₹1035.7. Stock has given CAGR of over 30% for 10 years and the volatility is high right now, and stock has also fallen from its all-time high. 

Tata Elxsi Ltd Global Leader
Tata Elxsi Ltd: Global Leader in Design, Technology, and AI Solutions for Healthcare Industries

Tata Elxsi Ltd: Overview 

Tata Elxsi Ltd is a global leader in design and technology services, offering innovative solutions across multiple industries, including Automotive, Media, Communications, and Healthcare. Established in 1989, the company is part of the Tata Group and specializes in providing integrated services that span research and strategy, electronics and mechanical design, software development, validation, and deployment. With a presence in over 30 countries, Tata Elxsi is supported by a network of global design studios, development centers, and offices worldwide. As per revenue bifurcation Software Development & Services contributes about 97% in revenue. And major revenue comes from Europe 42%, USA 34%, and India 18% and 6% Rest of World. Tata Elxsi has successfully launched Neuron, a powerful AI based platform network transformation. It won multi-million deals across domains cloud connection, 5G network, etc. 

Business Segments: 

  • Transportation: Transportation continues to be a strong beacon of growth for Tata Elxsi, powered by landmark deals in the software-defined vehicle (SDV) and electric vehicle (EV) space driven by our differentiated software capabilities. We also have a suite of EV solutions and expertise to provide OEM support for the design and development of inverters, electric motors, and battery management systems for EVs. Software Defined Vehicle Platform is a key trend in the automotive industry, with OEMs investing in developing in-house SDV platforms. With over 1,000,000 vehicles are now powered by TETHER, including personal vehicles, commercial vehicles, and EVs, the potential to leverage this platform for global OEMs are significant. 
  • Media & Communications: Our Media and Communications vertical posted a modest growth of 0.2% YoY, generating Rs. 1,217.5 crores revenue which comprises 35.3% of SDS operating revenue. Tata Elxsi has been chosen as a strategic partner for transformation of video services across multiple countries for a LATAM headquartered multi-country operator. They launched NEURON, our autonomous network platform that enables telecommunication operators to progress towards Zero-Touch Automation. Serving millions of subscribers with 10,000+ virtualised network functions. 
  • Healthcare & Life Sciences: The Healthcare & Life Sciences vertical posted a growth of 10.8% YoY, generating Rs. 484.9 crores revenue which comprises 14% of SDS operating revenue. The healthcare industry is at the inflection point of a digital transformation, with more institutions investing into connected and smart devices, shift of operations to digital workflows, usage of analytics and increased awareness of regulatory norms, resulting in the opening of new opportunities to enter the field of digital diagnostics and connected healthcare. 

Subsidiary Information: 

  • The company itself is a subsidiary of Tata Sons Pvt Ltd, which holds 42.2% stake in this company. 

Q2 FY25 & Business Highlights 

  • Revenue of ₹939 crore in Q3 FY25 up by 3% YoY from ₹914 crore in Q3 FY24.  
  • EBITDA of ₹247 crore in this quarter at a margin of 26% compared to 30% in Q3 FY24. 
  • Profit of ₹199 crore in this quarter compared to a ₹206 crore profit in Q3 FY24. 
  • All business segments showed a very less growth due to longer deals, soft quarters, etc. Healthcare segment grew by 1.1% YoY. 
  • Tata Elxsi launches an ODC in Pune for Suzuki Motor Corporation, Japan, to accelerate software and virtual development for next generation connected, EV, and ADAS technologies. 
  • Tata Elxsi won a multi-million long-term deal from a leading US headquartered MSO to manage a portfolio of applications that will ramp up over the next two quarters. 
  • Tata Elxsi selected to develop the next-generation connectivity platform for off-highway operations for a global leader in off-highway vehicles. 

Financial Summary 

INR Cr. Q3 FY24 Q3 FY25 FY23 FY24 
Revenue 914 939 3145 3552 
Expenses 644 693 2182 2505 
EBITDA 270 247 962 1047 
OPM 30% 26% 31% 29% 
Other Income 35 40 74 122 
Net Profit 206 199 755 792 
NPM 23% 21% 24% 22% 
EPS 33.2 31.95 121.3 127.2 
Tata Technologies Limited report
Tata Technologies Limited: Driving Innovation in Engineering and Digital Services

Tata Technologies Limited: Overview 

Tata Technologies is a leading global engineering and product development digital services company, specializing in providing end-to-end solutions for the automotive, aerospace, industrial machinery, and other manufacturing sectors. Founded in 1989 and headquartered in Pune, India, the company delivers services in product engineering, manufacturing engineering, and IT solutions, helping clients enhance product innovation, reduce time-to-market, and optimize costs. Tata Technologies leverages advanced technologies such as AI, IoT, and Industry 4.0 to support its clients in achieving digital transformation. With a global footprint and a focus on sustainable solutions, the company plays a pivotal role in driving innovation across the industrial landscape. The total employee headcount is 12680 employees as of Q2 FY25. The automotive segment contributes about 85% to the revenues. Tata Technologies has done Joint Venture with BMW Group. 

Latest Stock News (10 Jan 2025)

Tata Technologies Ltd. has signed a strategic memorandum of understanding MoU with Telechips to innovate vehicle software solutions for next generation software defined vehicles. Telechips is a global fabless semiconductor supplier, which provides SoC and MCU for the automotive industry and leads the system semiconductor market with its advanced products and technologies in the field of connectivity and multimedia semiconductors Jang-Kyu Lee, CEO of Telechips, stated: Our partnership with Tata Technologies highlights our commitment to transforming the automotive semiconductor landscape. By combining our advanced semiconductor solutions with their expertise in vehicle software and hardware integration, we are paving the way for safer, smarter, and more connected mobility solutions, enabling OEMs to lead in the SDV era. 

Shareholding Pattern as on September 2024 

Key Stats 

Market Cap ₹34025 Crore 
Revenue ₹5156 Crore 
Profit ₹657 Crore 
ROCE 28.3% 
P/E 52.6 

Peer Comparison 

Amt in ₹ Cr MCap Sales PAT ROCE Asset Turn. EV/EBITDA D/E P/E 
Tata Techno. 34025 5156 657 28.3% 0.95 32.27 0.08 52.6 
Coforge 63020 10144 788 28.6% 1.57 39.3 0.18 79.9 
KPIT Tech 38297 5410 726 38.6% 1.31 30.07 0.14 52.8 
Oracle Fin. 100546 6881 2495 39.5% 0.68 27.14 0.00 40.3 
Tata Elxsi 37551 3726 809 42.7% 1.19 30.46 0.08 46.4 

Financial Trends 

Amount in ₹ Cr 2020 2021 2022 2023 2024 
Revenue 2825 2381 3530 4414 5117 
Expenses 2382 1995 2884 3593 4176 
EBITDA 470 386 646 821 941 
OPM 16% 16% 18% 19% 18% 
Other Income 36 39 49 88 116 
Net Profit 252 239 437 624 679 
NPM 8.92% 10% 12% 14% 13% 
EPS – – – 15.38 16.75 

Stock Price Analysis 

In terms of performance, Tata Technologies has shown a return of -4.24% in one day, -11.15% over the past month, and -21.26% in the last three months. Over the past 52 weeks, the shares have seen a low of ₹870 and a high of ₹1200. The price of stock has fell from the IPO listing price and has never reach at that levels. The stock is trading at all-time lows. 

Capital Infra Trust InvIT IPO
Capital Infra Trust InvIT IPO: Should you Apply or Not?

Capital Infra Trust InvIT is a book built issue of Rs 1,578.00 crores. The issue is a combination of fresh issue of 10.77 crore shares aggregating to Rs 1,077.00 crores and offer for sale of 5.01 crore shares aggregating to Rs 501.00 crores. 

About Capital Infra Trust InvIT 

Capital Infra Trust, established in 2023, operates as an infrastructure investment trust sponsored by Gawar Construction Limited, a company renowned for building roads and highways across 19 states in India. It collaborates with prominent government bodies such as NHAI, MoRTH, MMRDA, and CPWD. On November 11, 2024, the Trust received a ‘Provisional CRISIL AAA/Stable’ rating from CRISIL Ratings Limited for its NCD(s) and proposed long-term bank loan facility.  

Gawar Construction Limited, since 2008, has completed 100 projects and currently manages 26 projects under the Hybrid Annuity Model (HAM) for the National Highways Authority of India (NHAI). The assets and portfolio of Capital Infra Trust are owned, managed, and operated through Project SPVs. Financially, the firm’s revenue has shown fluctuations over the years, with figures of ₹1,908.15 crore in 2022, ₹2,033.09 crore in 2023, and ₹1,485.09 crore in 2024. 

IPO Subscription Period 

  • Open Date: January 7, 2025 
  • Close Date: January 9, 2025 
  • Allotment Date: January 10, 2025 
  • Listing Date: January 14, 2025 
  • Stock Exchanges: BSE and NSE 

Pricing Details  

  • Price Band: ₹99 – ₹100 per Share 
  • Face Value: ₹10 per Share 
  • Minimum Lot Size: 150 shares 
  • Investment Requirement: 
  • Retail Investors: Minimum ₹15000 (150 shares) 
  • Small Non-Institutional Investors (sNII): 14 lots (2100 shares) – ₹210000 
  • Big Non-Institutional Investors (bNII): 67 lots (10050 shares) – ₹1005000 

Reservation Structure 

  • Anchor Investors: 0%  
  • Qualified Institutional Buyers (QIB): 75% 
  • Non-Institutional Investors (NII): 25%  
  • Big NII (bNII): 15% 
  • Small NII (sNII): 10% 
  • Retail Investors: 0% (0 shares) 

Key Dates and Timeline 

  • IPO Open Date: Tuesday, January 7, 2025 
  • IPO Close Date: Thursday, January 9, 2025 
  • Basis of Allotment: Friday, January 10, 2025 
  • Initiation of Refunds: Monday, January 13, 2025 
  • Credit of Shares to Demat: Monday, January 13, 2025 
  • Listing Date: Tuesday, January 14, 2025 
  • Cut-off time for UPI mandate confirmation: 5 PM on January 9, 2025 

Book Running Lead Managers 

Capital Infra Trust InvIT has appointed prominent financial institutions as book-running lead managers for the IPO: 

  • SBI Capital Markets Ltd 
  • HDFC Bank Ltd 

Kfin Technologies Limited has been designated as the registrar for the IPO. 

Financial Highlights 

  • Revenue: In FY22 revenue was ₹1981 crores, in FY23 it was ₹2518 and in FY24 it is ₹1543 crores. 
  • Profit after Tax (PAT): FY22- ₹126 crore, FY23- ₹498 crores and FY24- ₹126 crores. 

IPO Objectives 

The Company intends to utilize the Net Proceeds for the following purposes: 

  • Providing loans to the Project SPVs for repayment/pre-payment of external borrowings, in part or in full from the financial lenders (including any accrued interest and prepayment penalty); and 
  • Providing loans to the Project SPVs for repayment of unsecured loans availed by the Project SPVs from the Sponsor. 

Subscription Status (As of January 08, 2025) 

  • Retail: - 
  • QIB: - 
  • NII: - 
  • Overall Subscription: – 

Recommendation 

We recommend investors to apply as the company is Trust Investment firm which takes our money and invests in projects to earn returns. From total revenue they will distribute fixed percentage of revenue as dividend to the investors. It will be great for investors as a fixed income in their portfolio. 

Kalyan Jewellers
Kalyan Jewellers: Expanding Horizons with Robust Growth and Global Presence

Kalyan Jewellers India Limited: Overview 

Kalyan Jewellers India Ltd. designs, manufactures, and sells a diverse range of gold, studded, and other jewellery products catering to various price points. Founded by Chairman and MD T.S. Kalyanaraman, the company is one of India’s largest jewellery retailers, with approximately 6% of the organized market share. Its offerings include wedding jewellery under the Mahurat brand, aspirational handcrafted pieces under brands like Mudhra and Rang, value-oriented regional jewellery under Aishwaryam, and studded collections like Nimah and Ziah. Gold jewellery contributes 73% of its product mix, while studded jewellery accounts for 25%. By FY24, Kalyan expanded to 204 showrooms in India (up from 124 in FY22) with over 711,000 sq. ft. of retail space in India and 44,000 sq. ft. across four Middle Eastern countries. The company is transitioning to a Franchisee Owned Company Operated (FOCO) model in regions like South India and the Middle East to optimize capital investment and boost operational margins. 

Latast Stock News (9 Jan 2025) 

Kalyan Jewellers India Ltd reported a consolidated revenue growth of approximately 39% for Q3 2025 compared to previous year quarter. The jeweller has launched 24 Kalyan showrooms in India during recent quarter. The Middle East recorded 22% growth and contributes 11% to the revenue of Kalyan Jewellers Ltd. The company has also launched its first showroom operated by company itself in USA. Company is planning to launch 30 Kalyan and 15 Candere showrooms during current quarter. 

Shareholding Pattern as on September 2024 

Key Stats 

Market Cap ₹72867 Crore 
Revenue ₹21385 Crore 
Profit ₹626 Crore 
ROCE 14.04% 
P/E 117 

Peer Comparison 

Amt in ₹ Cr MCap Sales PAT ROCE Asset Turn. EV/EBITDA D/E P/E 
Kalyan Jewellers 72876 21358 626 14.04% 1.58 51.7 1.04 117 
Titan Company 309384 54458 3243 22.7% 1.74 57 2.22 95 
Senco Gold 9202 5654 218 13.8% 1.58 21.6 1.3 42.1 
PC Jewellers 8144 995 15.4 -1.74% 0.08 76 1.17 532 
P N Gadgil Jewel. 9125 6032 155 30.8% 4.8 32.9 0.16 59.1 

Financial Trends 

Amount in ₹ Cr 2020 2021 2022 2023 2024 
Revenue 10101 8573 10818 14071 18548 
Expenses 9302 7949 9965 12906 17180 
EBITDA 799 624 853 1165 1368 
OPM 8% 7% 8% 8% 7% 
Other Income 80 45 38 74 
Net Profit 142 -6 224 432 596 
NPM 1.4% -0.1% 2.1% 3.1% 3.2% 
EPS 1.7 -0.06 2.18 4.2 5.8 

Stock Price Analysis 

In terms of performance, Kalyan Jewellers India has shown a return of -2.21% in one day, -8.86% over the past month, and -0.55% in the last three months. The stock has experienced fluctuations today, with a low of ₹663.6 and a high of ₹725.4, over the past 52 weeks; the shares have seen a low of ₹322.05 and a high of ₹794.6. The stock has given great returns since its listing and the trading volumes are also high showing high interest from investors. 

Dixon Technologies: Leading India’s EMS Revolution

Dixon Technologies (India) Limited: Overview 

Established in 1993, is a leading Electronics Manufacturing Services (EMS) provider in India, operating across segments like consumer electronics, lighting, home appliances, CCTVs, mobile phones, and reverse logistics. It also produces security surveillance equipment, wearable, audible, and AC-PCBs. The company recently formed a joint venture with Imagine Marketing Pvt Ltd. for wireless audio solutions. As one of India’s largest LED TV manufacturers, Dixon caters to over 35% of the country’s demand and is a leading ODM player in lighting with extensive capacity across SKUs. It has the largest semi-automatic washing machine portfolio with models ranging from 6 kg to 14 kg. Headquartered in Noida, Dixon has 22 manufacturing facilities across India. It plans a capital expenditure of ₹300-400 crore annually over the next two years, alongside debt repayment obligations of ₹90-110 crore per year. Notable achievements include manufacturing 11 million smartphones, 26 million feature phones, and rolling out India’s first ODM-based Google TV solutions. 

Lasted Stock News (9 Jan 2025) 

There was a fall in stocks of Dixon, Kaynes tech, PG Electroplast and CG Power. The reason was that Tata Group is investing about $18 billion in the field of electronics and semiconductors and will open nine new factories in next two years. There is still ₹41,000 crore worth unpledged subsidies of government remains unallocated because some companies did not meet production levels. 

Shareholding Pattern as on September 2024 

Key Stats 

Market Cap ₹101573 Crore 
Revenue ₹27590 Crore 
Profit ₹561 Crore 
ROCE 9.16% 
P/E 180 

Peer Comparison 

Amt in ₹ Cr MCap Sales PAT ROCE Asset Turn. EV/EBITDA D/E P/E 
Dixon Tech 101573 27590 561 29.2% 3.03 94.6 0.35 180 
Kaynes Tech 44613 1474 187 11.2% 0.58 131 0.18 240 
PG Electroplast 26893 3600 192 12.6% 1.44 75 0.4 140 
CG Power 106138 8810 896 46.6% 1.56 80.7 0.01 119 
Genus Power 11783 1581 146 11.34% 0.54 37 0.7 80.1 

Financial Trends 

Amount in ₹ Cr 2020 2021 2022 2023 2024 
Revenue 4400 6448 10697 12192 17691 
Expenses 4172 6156 10313 11673 16986 
EBITDA 228 292 384 519 705 
OPM 5% 5% 4% 4% 4% 
Other Income 32 
Net Profit 120 160 190 255 375 
NPM 2.7% 2.5% 1.8% 2.1% 2.1% 
EPS 20.8 27.6 32.05 42.9 61.5 

Stock Price Analysis 

In terms of performance, Dixon Technologies (India) has shown a return of -8.36% in one day, -2.47% over the past month, and 16.42% in the last three months. Over the past 52 weeks, the shares have seen a low of ₹5785 and a high of ₹19149.8. Dixon has seen a huge rally over several years increasing interest from investors and the expanding industry has benefited the company stock price to grow further. The trading volumes are high and stock is one of trending stocks in recent times. 

ITC Limited Overview
ITC Limited: Comprehensive Overview and Strategic Stake Acquisitions in EIH-HLV

ITC Limited: Overview 

ITC is the largest cigarette manufacturer and seller in the country. Established in 1910, it operates in five business segments- Cigarettes, Hotels, FMCG, Paper& Packaging and Agriculture business. ITC has 80% market share in cigarette industry and is market leader in other segments also. The contribution of export revenue is 23% of the total ITC revenue. The revenue split is Cigarette 37%, FMCG 24%, Hotels 4%, and Paper & Packaging 10%, Agriculture 22%. The hotel business was demerged from ITC Ltd and made new entity ITC Hotels Ltd and ITC Ltd kept its 40% holdings and rest 60% is held by existing shareholders of ITC Ltd. 

Latest Stock News (7 Jan 2025) 

ITC holds some hotel companies like Fortune Park Hotels Ltd, Bay Island Hotels Ltd, and Landbase India Ltd and WelcomeHotels Pvt Ltd which are wholly owned subsidiary by ITC Ltd. Others are subsidiary, associates and Joint Venture, which all are going to be demerged from ITC Ltd to ITC Hotels Ltd and all shares will be held by ITC Hotels Ltd. In mid-December, ITC acquired stakes in two hotel companies, EIH Ltd and HLV Ltd, and the acquired stakes are 16.13% and 8.11% respectively. 

Shareholding Pattern as on September 2024 

Key Stats 

Market Cap ₹565842 Crore 
Revenue ₹75135 Crore 
Profit ₹20549 Crore 
ROCE 37.47% 
P/E 27.56 

Peer Comparison 

Amt in ₹ Cr MCap Sales PAT ROCE Asset Turn. EV/EBITDA D/E P/E 
ITC 565842 75135 20549 37.47% 0.8 19.03 0.00 27.56 
Godfrey Phillips 25850 4769 943 22.17% 0.82 22.21 0.05 27.37 
Dabur 89262 12447 1759 22.28% 0.86 31.39 0.17 5..78 
VST 5599 1419 243 32.24% 0.84 15.23 0.00 23.04 

Financial Trends 

Amount in ₹ Cr 2020 2021 2022 2023 2024 
Revenue 49388 49257 60645 70919 70866 
Expenses 30044 32193 40021 45215 44634 
EBITDA 19344 17065 20623 25704 26233 
OPM 39% 35% 34% 36% 37% 
Other Income 2417 2577 1910 2098 2804 
Net Profit 15593 13383 15503 19477 20751 
NPM 31.6% 27.2% 25.6% 27.5% 29.3% 
EPS 12.45 10.69 12.37 15.44 16.39 

Stock Price Analysis 

In terms of performance, ITC has shown a return of -6.64% in one day, -3.69% over the past month, and -10.62% in the last three months. Over the past 52 weeks, the shares have seen a low of ₹399.3 and a high of ₹528.55. The share price has increased in really good manner in accordance with its financial and the volatility is in normal range but the trade volumes have increased in recent times.

Jupiter Wagons Ups Stake
Jupiter Wagons Ups Stake in Electric Mobility to 75%, Eyes Railway Growth

Jupiter Wagons Limited: Overview 

Jupiter Wagons known as Commercial Engineers & Body Builders Company Ltd is involved in business of metal fabrication of load bodies for commercial vehicles, rail freight wagons and its components. The rail mobility business is for open, flat, covered, defence wagons and wagon accessories, passenger coach accessories, wheel sets and track solutions. It also makes water tankers, BESS container, data center containers, marine containers, brake systems and discs, etc. Railway wagons contribute about 84% of the company’s revenue and commercial vehicle load bodies and components about 11%. The order book of company is ₹7000+ crores with the clientele of Tata Motors, Mahindra, JSW Steel, Adani Ports and Logistics, etc. The company has total 12 manufacturing facilities in India, with a production capacity of 8000 wagons per year. 

Latest Stock News (7 Jan 2025) 

Jupiter Wagons Ltd. has its subsidiary Jupiter Electric Mobility Pvt Ltd. with stake of 60% and on December 31st Jupiter Wagons Ltd has increased their stake by 15% to 75% of its paid-up share capital. Jupiter Wagons with other railway stocks has risen up by 7%-10%, hoping a recovery in central government capex and major announcements from the Union Budget for railway sector. 

Shareholding Pattern as on September 2024 

Key Stats 

Market Cap ₹20304 Crore 
Revenue ₹3877 Crore 
Profit ₹365 Crore 
ROCE 31.67% 
P/E 55.56 

Peer Comparison 

Amt in ₹ Cr MCap Sales PAT ROCE Asset Turn. EV/EBITDA D/E P/E 
Jupiter Wagons 20304 3877 365 31.67% 1.64 35.9 0.16 55.56 
Titagarh Rail 14642 3967 304 24.97% 1.47 28.94 0.21 48.2 
Jyoti CNC Auto 30583 1620 274 21.22% 0.72 69.4 0.17 111.4 
Texmaco Rail 7582 4475 208 10.59% 0.93 17.84 0.35 36.5 

Financial Trends 

Amount in ₹ Cr 2020 2021 2022 2023 2024 
Revenue 127 82.9 105 123 87.9 
Expenses 114 72 95.8 113 80.2 
EBITDA 12.38 11.3 9.6 10.25 7.7 
OPM 10% 14% 9% 8% 9% 
Net Profit 7.62 7.9 7.4 8.08 5.5 
NPM 6.0% 9.5% 7.0% 6.6% 6.3% 
EPS 4.56 4.75 4.4 4.83 3.3 

Stock Price Analysis 

In terms of performance, Jupiter Wagons has shown a return of -5.71% in one day, -2.81% over the past month, and -2.14% in the last three months. Over the past 52 weeks, the shares have seen a low of ₹301 and a high of ₹748.05. As the railway industry in major eyesight, the stock has rallied great and the volume traded has increased compared to the past. There is some fluctuation in stock but before Union Budget there is a chance for rally in stock in short term.