sbi bank Q2 Results
SBI Q2 Results: Net Profit Soars 28% to ₹18,331 Crore, Surpassing Market Forecasts

Company Overview

State Bank of India (SBI), incorporated on July 1, 1955, emerged following the nationalization of the Imperial Bank of India, with the Reserve Bank of India acquiring a 60% stake. SBI is a leading Indian multinational bank, headquartered in Mumbai, offering a broad array of financial services to individual, corporate, and institutional clients. Its extensive network is structured into four primary segments: Treasury, Corporate/Wholesale Banking, Retail Banking, and Other Banking Business. Through these, SBI provides personal banking, investment portfolios, and corporate banking services.

SBI operates one of the largest banking networks in India, with over 22,000 branches and a substantial overseas presence with 227 offices across 30 countries. Its international operations support global financial transactions from key cities like New York, Tokyo, and London. SBI also led in online initiatives, including SBI e-tax for digital tax payments, and expanded its digital footprint with innovative offerings like the SBI Virtual Debit Card for enhanced online security.

Through the years, SBI has grown through the acquisition and merger of associate banks and partnerships. Notably, in 2017, SBI absorbed five associate banks and the Bharatiya Mahila Bank, making it one of the largest global banking networks. Internationally, SBI has established joint ventures, such as the Payments Bank with Reliance Industries and collaborations with Visa and Elavon for merchant acquiring businesses.

In addition, SBI’s insurance arm, SBI Life Insurance Company, is a joint venture with Cardif S.A., and its asset management subsidiary, SBI Funds, earned the title of ‘Mutual Fund of the Year’. Domestically, SBI supports government initiatives with specialized products like the Defence Salary Package and loans for senior citizens. Its technology-driven offerings serve to enhance customer experience across both urban and rural areas.

Industry Outlook

Based on the recent financial results and statements from the chairman of State Bank of India (SBI), the industry outlook for FY25 and beyond appears positive, with several key factors contributing to growth and stability. Global growth is expected to remain stable, with the US economy showing a positive outlook, which may lead to lower taxes and favorable regulations that could benefit the Indian economy, particularly in manufacturing and strategic alliances. Additionally, a positive shift in the geopolitical situation could help lower commodity prices, benefiting India and other economies globally. India continues to be the fastest-growing large economy, with a 6.7% GDP growth in Q1 FY25, supported by private consumption, investment, and agriculture, as well as strong demand expected during the festival season.

For the banking sector, scheduled commercial banks, including SBI, are expected to see deposit growth of 11-12% and credit growth of 12-13% in FY25, with a positive deposit credit differential, which signals a healthy banking environment. The Reserve Bank of India (RBI) is maintaining comfortable system liquidity, which is helping support stable credit growth in the sector.

SBI itself has crossed a significant milestone, with deposits reaching ₹51.17 trillion, reflecting steady growth in its CASA deposits, which remains a strong aspect of the bank’s financial performance. Credit growth for SBI is up by 14.93% year-on-year, driven by strong performance across corporate, retail, agriculture, and MSME sectors, positioning the bank for continued market leadership. Its asset quality remains strong, with a slippage ratio of 0.51% and a PCR of 75.6%, ensuring a well-provided loan book. The bank’s capital adequacy ratio is at a solid 13.76%, well above regulatory requirements, indicating sufficient capital to support growth.

SBI’s digital transformation is another key driver of its future growth. With over 8 crore customers on its digital platforms, the bank continues to innovate in digital banking, with 61% of regular savings accounts opened digitally in Q2 FY25. The bank is focused on expanding its digital channels and strengthening its branch networks to maintain its competitive edge in the market. Furthermore, SBI’s subsidiaries, including SBI Life Insurance and SBI Funds, continue to perform well and contribute significantly to the bank’s diversified revenue streams, ensuring long-term growth.

In conclusion, SBI’s strong financial performance, particularly in credit growth, robust deposits, and its focus on digital banking, positions the bank well to benefit from the positive outlook of the Indian economy and the overall banking sector. The bank’s commitment to sustainable growth and delivering superior shareholder value over the long term remains central to its strategic priorities.

Business Segments

State Bank of India (SBI) operates across several key business segments, each contributing significantly to the bank’s overall performance. Based on the Q2 FY25 results, here’s an analysis of these segments:

  • Treasury: This segment manages the bank’s investments and foreign exchange risks, as well as its bond holdings and market-based activities. The Q2 FY25 performance indicates favorable market conditions, contributing positively to the bank’s financial performance.
  • Corporate/Wholesale Banking: This segment serves large corporate and government clients, offering services like working capital finance and trade finance. In Q2 FY25, corporate advances saw an impressive 18.35% year-on-year growth, contributing to an overall credit growth of 14.93%. This indicates robust demand from the corporate sector.
  • Retail Banking: Serving individual customers, this segment focuses on products like personal loans, home loans, and savings accounts. The retail banking segment grew by 12.32% year-on-year in Q2 FY25, driven by demand for affordable housing and personal finance, supported by SBI’s extensive digital and physical network.
  • Other Banking Business: This includes wealth management, insurance, and asset management services. Subsidiaries like SBI Life Insurance and SBI Funds Management continue to perform well, contributing non-interest income and diversifying the bank’s revenue streams.
  • International Operations: SBI’s international segment, which covers over 30 countries, contributes through remittances, trade finance, and cross-border services. This segment grew by 11.56% year-on-year in Q2 FY25, reflecting the bank’s strong global presence.

SBI’s diversified operations across these segments, along with its focus on digital banking and strong capital base, position it well for continued leadership in the Indian banking sector​.

Key Subsidiaries and Their Information

State Bank of India (SBI) has a diverse portfolio of subsidiaries, joint ventures, and associates that contribute significantly to its operations and financial performance. Below is an overview of some of the key subsidiaries and joint ventures, along with their insights:

  • SBI Life Insurance Company Ltd:  As one of India’s largest private life insurance companies, SBI Life offers a broad range of products, including individual and group life insurance, pension plans, and health insurance. It continues to experience strong growth and holds a significant market share in the Indian life insurance industry. The company benefits from SBI’s vast customer base and extensive distribution network.
  • SBI General Insurance Company Ltd: This subsidiary focuses on general insurance, providing products like health, motor, travel, and home insurance. SBI General is rapidly expanding its reach across India, leveraging the bank’s nationwide distribution network to increase market penetration and cater to a broader customer base.
  • SBI Cards and Payment Services Limited: A leading player in the Indian credit card market, SBI Cards issues a wide range of cards catering to different customer segments. It continues to innovate in the digital payments space and has a strong presence in the Indian payments’ ecosystem, contributing to the broader digitalization trends in banking and finance.
  • SBI Capital Markets Ltd (SBICAP): As the investment banking arm of SBI, SBICAP offers services such as corporate advisory, capital markets, and investment banking. It is particularly known for its expertise in handling large IPOs, mergers and acquisitions, and other capital market activities, making it an important player in India’s financial services sector.
  • SBI Funds Management Ltd: SBI Funds is a major player in India’s mutual fund industry, managing a variety of mutual fund schemes for both retail and institutional clients. With its strong investment capabilities and a wide array of offerings, it plays a pivotal role in helping investors manage their portfolios.
  • SBI Payments Services Pvt Ltd: This subsidiary is instrumental in expanding SBI’s footprint in the digital payments landscape. It provides innovative payment solutions, including point-of-sale (POS) terminals, digital wallets, and online payment services, contributing to the bank’s leadership in India’s digital banking sector.
  • SBI Global Factors Ltd: SBI Global Factors offers factoring services primarily to small and medium-sized enterprises (SMEs), helping them improve their liquidity by allowing them to sell their receivables. This service is especially valuable for SMEs seeking to manage cash flow more effectively.
  • SBI Ventures Ltd: Formerly known as SBICAP Ventures, SBI Ventures focuses on investments in growth-stage companies, particularly in emerging sectors like technology and healthcare. Its venture capital activities align with SBI’s broader strategy to diversify beyond traditional banking and explore high-growth industries.
  • State Bank of India (UK) Limited: SBI UK provides a range of retail and corporate banking services in the UK. It supports the bank’s international growth by catering to both individual customers and businesses, particularly those with ties to India, enhancing SBI’s presence in the international banking sector.
  • SBI (Mauritius) Ltd: This subsidiary focuses on providing banking services in Mauritius, which acts as a gateway for SBI’s expansion into Africa. By offering a variety of financial services, SBI (Mauritius) plays an important role in strengthening the bank’s international portfolio and capitalizing on opportunities in the African market.

Each of these subsidiaries plays a key role in diversifying SBI’s business operations and bolstering its presence across multiple sectors such as insurance, payments, investment banking, and asset management. This diverse portfolio allows SBI to maintain its leadership in the Indian banking sector while also expanding globally.

Key Joint Ventures of SBI

  • SBI Macquarie Infrastructure Management Pvt. Ltd: A joint venture between SBI and Macquarie Group, this entity focuses on managing infrastructure investments in India, particularly in areas like roads, power, and utilities.
  • SBI Macquarie Infrastructure Trustee Pvt. Ltd: This joint venture manages infrastructure investment trusts, which help in raising capital for infrastructure projects across India.
  • Jio Payments Bank Ltd: A partnership between SBI and Reliance Jio, Jio Payments Bank aims to offer digital payment solutions and banking services to customers, especially in rural and semi-urban areas.
  • Oman India Joint Investment Fund – Management Co Pvt. Ltd: This JV focuses on managing investments in India, especially in sectors that attract foreign investments.

   Key Associates of SBI

  • Andhra Pradesh Grameen Vikas Bank: This associate focuses on providing banking services to rural populations in Andhra Pradesh, particularly to promote financial inclusion.
  • Nepal SBI Bank Ltd: This associate operates in Nepal, providing a range of banking services to the growing market there.
  • Commercial Indo Bank LLC, Moscow: This associate bank serves Indian expatriates and businesses in Russia, helping them with banking and financial services.

Q2 FY25 Highlights

  • This Q2FY25 data indicates a solid performance with key highlights across profitability, business growth, asset quality, and digital leadership.
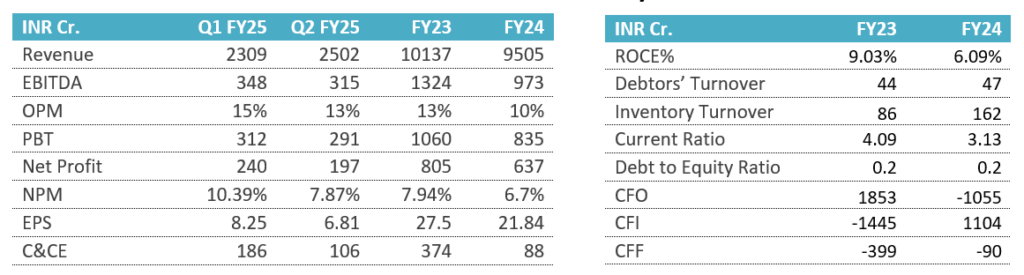
  • Profitability: The bank reported a Net Profit of ₹18,331 crores in Q2FY25, showing robust earnings. Return on Assets (ROA) was at 1.13% for H1FY25, and Return on Equity (ROE) was 21.78%, reflecting efficient use of equity capital. The Net Interest Margin (NIM) was 3.18% for the whole bank and slightly higher in domestic operations at 3.31%, which supports sustainable profitability.
  • Business Growth: The bank’s deposits crossed the ₹51 trillion mark, growing 9.13% YoY, while advances exceeded ₹39 trillion, with a strong 14.93% YoY growth in credit. This broad-based growth demonstrates expansion in both deposits and credit across market segments, positioning the bank for continued market share growth in a competitive environment.
  • Asset Quality: Improvements in asset quality are evident, with Gross NPA at 2.13% and Net NPA at 0.53%, reflecting strong risk management. The credit cost for H1FY25 was 0.43%, indicating reduced provisioning needs due to improved loan quality. The Provision Coverage Ratio (PCR) stands at 75.66%, and including AUCA (Accounts Under Collection Account), it reaches 92.21%, demonstrating conservative provisioning for stressed assets.
  • Well-Provided Stressed Book: Additional provisions of ₹31,084 crores are set aside, equating to 153% of Net NPAs, which adds a layer of resilience and minimizes potential future losses from non-performing assets.
  • Digital Leadership: Digital transformation is leading growth, with >98% of transactions occurring through alternate channels. The bank’s mobile app, YONO, has 8.13 crore registered users, reinforcing its digital-first strategy. Notably, 61% of savings accounts were opened via YONO in Q2FY25, underscoring its impact on customer acquisition and engagement.
  • The bank’s liability franchise benefits from brand trust and market share dominance (~22% in deposits), with a 10.05% YoY growth in current account balances. Its credit-to-deposit ratio at 67.87% indicates a healthy balance between deposit inflows and lending activities.
  • The Central Board has approved raising up to ₹20,000 crore in long-term bonds during FY25. These funds may be raised via public issue or private placement, providing the flexibility to select the best approach based on market conditions. The initiative aims to enhance the bank’s capital base, supporting business growth, credit expansion, and financial resilience. This capital boost aligns with the bank’s strategic goals of strengthening its capital structure and sustaining a healthy credit-to-deposit ratio for stable, long-term growth.

Financial Summary (Standalone)

TypeQ2FY25Q1FY25Q2FY24Q-o-Q (%)Y-o-Y (%)
Interest Income1,13,8711,11,5261,01,3792.1%12.3%
Interest Expenses72,25170,40161,8792.6%16.8%
Net Interest Income41,62041,12539,5001.2%5.4%
Non-Interest Income15,27111,16210,79136.8%41.5%
Operating Income56,89052,28750,2918.8%13.1%
Interest on Deposits63,20160,34054,4744.7%16.0%
Interest on Borrowings5,8297,2114,594-19.2%26.9%
Other Interest paid3,2212,8502,81113.0%14.6%
Total Interest Expenses72,25170,40161,8792.6%16.8%
Salary11,90111,9679,706-0.6%22.6%
Provisions for Employees2,9063,4999,221-16.9%-68.5%
Staff Expenses14,80715,46618,926-4.3%-21.8%
Overheads12,78910,37311,94823.3%7.0%
Of which: Business Acquisition & Development Expenses1,4911,0611,50940.5%-1.2%
Operating Expenses27,59625,83930,8746.8%-10.6%
Total Expenses99,84796,23992,7533.7%7.6%
Operating Profit29,29426,44919,41710.8%50.9%
Total Provisions10,9629,4135,08716.5%115.5%
Net Profit18,33117,03514,3307.6%27.9%
NIM (Whole Bank) (%)3.143.223.29-2.5%-4.6%
NIM (Domestic) (%)3.273.353.43-2.4%-4.7%
Cost to Income Ratio (%)48.5149.4261.39-1.8%-21.0%
Cost to Assets (%)1.761.672.175.4%-18.9%
Ratios (Annualized)Q2FY25Q1FY25Q2FY24
ROA (%)1.171.101.01
ROE (%)20.98
Earning Per Share (₹)81.4976.5663.88

SWOT Analysis

Strengths:

  1. Market Leadership
  2. Extensive Branch and ATM Network
  3. Ongoing Digital Transformation
  4. Strong Government Support and Diverse Product Portfolio

Weaknesses:

  1. High Debt Levels
  2. Constraints of Public Sector Operations
  3. Heavy Reliance on the Domestic Market

Opportunities:

  1. Growth in Digital Services
  2. Expansion in Rural Banking
  3. Increasing Demand for Retail Loans
  4. Supportive Government Initiatives

Threats:

  1. Fierce Market Competition
  2. Regulatory Compliance Risks
  3. Cybersecurity Vulnerabilities
  4. Impact of Rising Interest Rates

Raymond Lifestyle Q2 Results
Raymond Lifestyle Q2 Results: Profit Declines 70% YoY to ₹42 Crore

Company Overview

Raymond Lifestyle Limited, originally incorporated as “Ray Universal Trading Private Limited” on October 26, 2018, has evolved through several name changes. It became a public limited company on March 3, 2020, under the name “Ray Universal Trading Limited,” then rebranded as “Raymond Consumer Care Limited” on July 18, 2020. Finally, on May 2, 2024, it received a fresh certificate of incorporation, formally adopting the name “Raymond Lifestyle Limited.”
Raymond Lifestyle is a leading India-based fashion and retail company specializing in textiles, branded suiting and shirting, and ready-to-wear clothing. Known for its extensive men’s fashion brands and retail network, the company has a diverse portfolio that includes formal, casual, and ethnic wear through brands like Raymond, Park Avenue, ColorPlus, Parx, and Ethnix by Raymond. The Composite Scheme of Amalgamation & Arrangement in 2024 further strengthened its position by demerging the Lifestyle Business Undertaking of Raymond Limited into Raymond Lifestyle Limited.
Raymond Lifestyle operates across various business segments, including branded apparel, suiting, shirting, garmenting, and retail initiatives like The Raymond Shop, Raymond Made to Measure, Raymond Home, and Ethnix. With a fabric manufacturing capacity of around 43 million meters, the company produces high-quality fabrics from wool, poly-wool, silk, and other premium blends. The Ethnix by Raymond brand provides a curated collection of ready-made ensembles for festive and special occasions, while Raymond Made to Measure offers customized suits, formal jackets, and shirts. In addition, Raymond Home presents a range of contemporary home linens, including bedsheets, towels, and comforters, meeting modern decor needs.

Industry Outlook

India’s textiles sector is one of the oldest industries in the country, deeply rooted in agriculture for raw materials such as cotton, and it is an integral part of India’s cultural heritage. The sector offers a wide variety of fibers and yarns, from natural fibers like cotton, silk, and wool, to synthetic fibers such as polyester and nylon. The largest component of the industry consists of the decentralized power looms and knitting sector.

India ranks among the top five global exporters of textiles and apparel, contributing 2.3% to the GDP, 13% to industrial production, and 12% to exports. With approximately 45 million workers in the textile industry, including 3.5 million handloom workers, the sector plays a significant role in employment.

The Indian technical textiles market is expected to grow to US$ 23.3 billion by 2027, driven by rising consumer demand. India’s broader textile market, valued at US$ 223 billion in 2021, is projected to reach US$ 350 billion by 2030, fueled by increasing export growth and domestic demand. The Indian government has set ambitious targets, aiming for US$ 250 billion in textile production and US$ 100 billion in exports by 2030. This goal is part of the five-step strategy: “Farms to Fibre to Fabric to Fashion to Foreign export,” aimed at positioning India as a leading global textile brand.

The Indian apparel market, valued at INR 5.5 trillion, is projected to grow at a CAGR of ~18.2% from FY23 to FY27, reaching INR 10.7 trillion by FY27. Within this, men’s wear represents ~41% of the market, valued at ~INR 2.2 trillion in FY23, and is expected to grow at a ~18% CAGR to reach INR 4.3 trillion by FY27. Western wear dominates the men’s apparel segment, holding a ~94% share, while ethnic wear accounts for about 6%. The men’s western wear market is expected to grow at 18% CAGR, reaching INR 4.1 trillion by FY27.

The Indian wedding market is valued at INR 11 trillion, with clothing expenses making up approximately 23% of the total, which estimates the wedding clothing market at INR 2.5 trillion. Of this, men’s clothing represents 30%, valued at INR 750 billion, while women’s and children’s wear accounts for 70%. Raymond, with a strong presence in men’s wear, holds ~5% of the Indian men’s wedding wear market, where wedding wear contributes 35-40% to its business. Raymond Lifestyle Limited (RLL) aims to grow its market share to 6-7% in men’s wedding wear by 2027, with a 15% CAGR.

The ethnic wear market, an important part of the wedding wear segment, is valued at INR 1.6 trillion and is expected to grow at an 18% CAGR from FY24 to FY27. The men’s ethnic wear segment, valued at INR 140 billion in FY23, makes up about 9% of the total ethnic wear market, with organized players holding a 38% share. This share is expected to increase to 45% by FY27, benefiting brands like Raymond.

Business Segments

Raymond Lifestyle operates through five main segments, each playing a significant role in its market presence and brand portfolio. Here’s an overview of each segment:

  • Branded Textile: This segment is the core of Raymond’s traditional business, offering high-quality worsted fabrics primarily used in men’s suiting and shirting. Known for fine craftsmanship and premium quality, Raymond has built a strong brand reputation in India’s textile market. Branded textiles cater to both business-to-business (B2B) and business-to-consumer (B2C) markets, including custom tailoring and branded fabric sales through exclusive retail outlets. Revenue declined to Rs 854 crore in Q2 FY25 from Rs 933 crore in Q2 FY24, due to muted demand and the impact of “Shraadh.” EBITDA margin dropped to 18.9% from 22.2%.
  • Branded Apparel: This segment covers ready-to-wear clothing under Raymond’s well-known apparel brands: Raymond, Park Avenue, ColorPlus, and Parx. Each brand within this segment targets a distinct market: Park Avenue focuses on premium formal wear, ColorPlus emphasizes casual wear, and Parx targets youth-oriented casual fashion. Branded Apparel has a wide distribution network through Raymond’s exclusive brand outlets, franchise stores, and online channels, meeting the demands of the modern consumer. Revenue slightly increased to Rs 441 crore in Q2 FY25, up from Rs 437 crore in Q2 FY24, supported by new store additions. EBITDA margin improved to 13.0% from 12.2%, with 52 new stores added, expanding the retail network to 1,592 stores as of September 30, 2024.
  • Garmenting: The Garmenting segment caters to both domestic and international markets by manufacturing ready-made garments, with a focus on exports. It leverages Raymond’s expertise in high-quality tailoring, supplying suits, jackets, trousers, and shirts for global brands and private labels. This segment benefits from the “Bangladesh +1” and “China +1” trends, which encourage international companies to source from India, making Raymond a key player in global garment production. Revenue decreased to Rs 260 crore in Q2 FY25 from Rs 286 crore in Q2 FY24 due to logistical delays in shipments. The EBITDA margin stood at 9.6%.
  • High Value Cotton Shirting: This segment focuses on producing high-quality cotton shirting fabrics, a premium product in Raymond’s portfolio. Known for quality and durability, these cotton shirting fabrics serve both Raymond’s branded apparel lines and external clients. The segment’s products are popular in both domestic and export markets, supporting Raymond’s reputation for luxury textiles. Revenue rose by 8% to Rs 228 crore in Q2 FY25 from Rs 211 crore in Q2 FY24, fueled by B2B demand for the festive and wedding season. However, EBITDA margin decreased to 9.7% due to higher input costs.
  • Others: The “Others” category includes Raymond’s smaller but strategic ventures, such as accessories (ties, belts, and wallets) and Made-to-Measure (MTM) services, which allow customers to personalize garments for an exclusive fit and style. This category also encompasses Raymond’s high-value wool-based and specialty fabrics, catering to niche markets. Together, these additional offerings enhance the brand’s portfolio and provide customers with complete lifestyle solutions.

Key Subsidiaries and Their Information

Here is an overview of Raymond Lifestyle’s key subsidiaries and their primary functions:

  • Raymond Luxury Cottons Limited: Focuses on producing premium cotton fabrics, including high-quality cotton shirting and luxury fabrics. Known for its high-thread-count cotton, this subsidiary plays a key role in Raymond’s presence in the luxury fabric market.
  • Silver Spark Apparel Limited: Engages in garment manufacturing and is one of the primary exporters of suits, jackets, and trousers. Caters to both domestic and international markets, supplying ready-made garments to global brands and private labels.
  • R&A Logistics Inc.: Raymond’s logistics arm, managing supply chain and distribution to ensure smooth operations across international markets. Plays a critical role in optimizing the transportation and delivery of Raymond’s products to various destinations.
  • Silverspark Middle East FZE: Focuses on Raymond’s business expansion in the Middle Eastern market, managing regional sales and distribution. Helps to position Raymond as a premium brand in apparel and textiles across the Middle East.
  • Silver Spark Apparel Ethiopia PLC: A manufacturing unit based in Ethiopia, supporting Raymond’s global garment production, particularly for export markets. This facility enhances Raymond’s cost-effectiveness and competitiveness in global markets, contributing to the “Africa +1” manufacturing strategy.
  • Raymond America Apparel Inc.: Serves as Raymond’s business presence in the US, dealing with apparel imports, distribution, and sales in North America. It strengthens Raymond’s international retail and B2B partnerships within the American market.
  • Jaykayorg AG: Based in Switzerland, this subsidiary manages global investments and asset management for the Raymond Group. It plays a strategic role in financial operations and investment growth for Raymond internationally.
  • Celebrations Apparel Limited: Specializes in the manufacturing of celebration and formal wear, including high-end and occasion-specific garments. Supports Raymond’s position as a leader in India’s wedding and festive wear market, a significant growth area for the company.
  • Raymond (Europe) Limited: Raymond’s European subsidiary, managing sales and distribution across Europe, including both branded apparel and textiles. Helps to expand Raymond’s footprint in European markets, targeting high-fashion and luxury fabric segments.
  • Ray Global Consumer Products Limited: Focuses on consumer products outside of apparel, including personal care, grooming, and lifestyle products. Expands Raymond’s brand into non-apparel consumer goods, reinforcing its image as a comprehensive lifestyle brand.

Each of these subsidiaries contributes to Raymond’s growth and market expansion, allowing it to operate across diverse geographies and product segments effectively.

Q2 FY25 Highlights

  • In Q2 FY25, Raymond Lifestyle’s total income was ₹1,735 crore, marking a 6% YoY decline from ₹1,849 crore in Q2 FY24 but showing growth from ₹1,250 crore in Q1 FY25. For H1 FY25, total income dropped 7% YoY to ₹2,985 crore from ₹3,203 crore in H1 FY24.
  • Operating expenses (Opex) in Q2 FY25 were ₹1,494 crore, slightly down from ₹1,543 crore in Q2 FY24, and rose from ₹1,160 crore in Q1 FY25. H1 FY25 Opex totaled ₹2,654 crore, compared to ₹2,718 crore in H1 FY24.
  • EBITDA was ₹242 crore in Q2 FY25, down 21% YoY from ₹306 crore in Q2 FY24 but up from ₹89 crore in Q1 FY25. For H1 FY25, EBITDA was ₹331 crore, a 32% YoY decline from ₹486 crore. The EBITDA margin in Q2 FY25 was 13.9%, down from 16.6% YoY but a notable improvement from 7.1% in Q1 FY25.
  • Profit Before Tax (PBT) dropped 45% YoY to ₹112 crore in Q2 FY25 from ₹203 crore in Q2 FY24, but this was a recovery from a ₹32 crore loss in Q1 FY25. PBT margin in Q2 FY25 was 6.5%, down from 11.0% YoY, but improved from -2.5% in Q1 FY25. H1 FY25 PBT was ₹80 crore, down 70% YoY from ₹264 crore.
  • Net Profit in Q2 FY25 reached ₹102 crore, a recovery from a ₹23 crore loss in Q1 FY25. However, after exceptional items, Q2 FY25 net profit stood at ₹42 crore, down from ₹139 crore in Q2 FY24. For H1 FY25, net profit after exceptional items was ₹19 crore, compared to ₹188 crore in H1 FY24, reflecting the impact of lower revenue and margin challenges over the period.
  • Raymond Lifestyle has demonstrated resilience in a challenging retail environment. The company’s focus on retail expansion, new product launches, and strategic marketing positions it to capitalize on the upcoming festive demand in India.
  • The operating highlights include the opening of 52 new stores, signaling a strong expansion of market presence. Customer acquisition efforts are ongoing, focusing on attracting and retaining a growing customer base. Additionally, the brand has expanded its product offerings with the introduction of a new sleepwear line, broadening its appeal and catering to customer demand for diverse products.
  • The economy and market updates indicate subdued consumer demand, with discretionary spending impacted primarily by inflation. Geopolitical tensions and persistently high inflation remain significant risks in international markets. Additionally, there was a lower offtake in September due to the ‘Shraadh’ period and ongoing muted consumer demand. Meanwhile, the Bangladesh +1 strategy is showing promise, as it has started receiving enquiries in the garmenting business.

Financial Summary

SWOT Analysis

Strengths:

  1. Established Brand Recognition
  2. Broad Product Range
  3. Extensive Retail Presence
  4. Integrated Production Processes

Weaknesses:

  1. Heavy Reliance on Indian Market
  2. Premium Price Positioning
  3. Limited Global Market Share

Opportunities:

  1. Rising Demand for Premium Lifestyle Products
  2. Growth in Casual Wear and Accessories
  3. Potential for International Expansion
  4. Emphasis on Digital Transformation

Threats:

  1. Economic Slowdown and Inflation
  2. Highly Competitive Industry Landscape
  3. Geopolitical Challenges and Supply Chain Risks
  4. Rapidly Changing Fashion Trends

NIva Bupa Limited IPO
Niva Bupa Ltd IPO: Review, Expert Analysis, and Investment Recommendations

Niva Bupa Health Insurance is set to launch its IPO with total issue size of ₹ 2200 crore, which comprises fresh issue of ₹800 crore and offer for sale of ₹1400 core.

IPO Subscription Period

  • Open Date: November 7, 2024
  • Close Date: November 11, 2024
  • Allotment Date: November 12, 2024
  • Listing Date: November 14, 2024
  • Stock Exchanges: BSE and NSE

Pricing Details

  • Price Band: ₹70 – ₹74 per Share
  • Face Value: ₹10 per Share
  • Minimum Lot Size: 200 shares
  • Investment Requirement:
    • Retail Investors: Minimum ₹14,800 (200 shares)
    • Small Non-Institutional Investors (sNII): 14 lots (2800 shares) – ₹207,200
  • Big Non-Institutional Investors (bNII): 68 lots (13,600 shares) – ₹1,006,400

Reservation Structure

  • Qualified Institutional Buyers (QIB): 30% (8,91,89,190 shares)
  • Non-Institutional Investors (NII): 15% (4,45,94,595 shares)
    • Big NII (bNII): 10%
    • Small NII (sNII): 5%
  • Retail Investors: 10% (2,97,29,730 shares)
  • Anchor Investors: 45% (13,37,83,783 shares) raising ₹8,315.28 crores

Key Dates and Timeline

  • IPO Open Date: Thursday, November 7, 2024
  • IPO Close Date: Monday, November 11, 2024
  • Basis of Allotment: Tuesday, November 12, 2024
  • Initiation of Refunds: Wednesday, November 13, 2024
  • Credit of Shares to Demat: Wednesday, November 13, 2024
  • Listing Date: Thursday, November 14, 2024
  • Cut-off time for UPI mandate confirmation: 5 PM on November 11, 2024

Book Running Lead Managers

Niva Bupa Health Insurance Limited has appointed prominent financial institutions as book-running lead managers for the IPO:

  • ICICI Securities Limited
  • Morgan Stanley India Company Private Limited
  • Kotak Mahindra Capital Company Limited
  • Axis Capital Limited
  • HDFC Bank Limited
  • Motilal Oswal Investment Advisors Limited

Kfin Technologies Limited has been designated as the registrar for the IPO.

Promoter Information

  • Promoter: Bupa Singapore Holdings Pte Ltd and Bupa Investments Overseas Limited.
  • Shareholding:
    • Pre-Issue: 62.27%
    • Post-Issue: 56%

About Niva Bupa Health Insurance Limited

Incorporated in 2008, Niva Bupa Health Insurance Company Limited is a joint venture between the Bupa Group and Fettle Tone LLP that provides insurance in the health sector.

Niva Bupa offers a variety of health insurance policies catering to individuals and families, covering hospitalization, pre- and post-hospitalization expenses, and additional benefits like annual health check-ups, daycare treatments, and ambulance services.

Popular plans include Health Companion, ReAssure, and GoActive, which provide customizable options to meet diverse healthcare needs. The company’s products are broadly categorized into

  1. Retail products designed for individuals and families.
  2. Group products intended for employers and employees.

As of March 31 2024, the company had 14.73 million active lives insured. As of March 31, 2024, the company is present across 22 states and four union territories in India.

Financial Highlights

  • Revenue Growth: Decreased by 21% from ₹413.07 crores (FY 2023) to ₹328.71 crores (FY 2024)
  • Profit After Tax (PAT): Rose by 650%, reaching ₹81.85 crores in FY 2024
  • Net Worth: ₹2049.6 crores
  • Total Borrowing: ₹250 crores

Key Performance Indicators (KPIs):

  • ROCE: 13.69%
  • RoNW: 5.68%
  • P/BV: 6.14
  • EPS (Pre-IPO): ₹0.48
  • EPS (Post-IPO): ₹-0.42
  • P/E Ratio (Pre-IPO): 153.7x
  • P/E Ratio (Post-IPO): -177.74x

IPO Objectives

The company proposes to utilise the Net Proceeds towards the following objects:

  1. Augmentation of its capital base to strengthen solvency levels and
  2. General corporate purposes

Subscription Status (As of November 8, 2024, 7:02:07 PM)

  • Retail: 0.76x
  • QIB: 0.83x
  • NII: 0.35x
  • Overall Subscription: 0.69x

Total Applications Received: 20,51,35,135 shares for 29,72,97,298 shares bid.

Recommendation

Apply (for Long-term investment) Niva Bupa Health Insurance Ltd. stands as one of the larger players in India’s health insurance sector, boasting strong financial performance and a well-diversified portfolio. However, the high Price-to-Earnings (PE) ratio indicates overvaluation, which could limit immediate upside. For those considering applying, tepid investor sentiment around the IPO suggests a relatively lower likelihood of strong listing-day gains. Long-term investors, however, may find potential in adding this stock to their portfolios, given the sector’s growth trajectory and Niva Bupa’s established market position.

Swiggy Limited IPO
Swiggy Limited IPO: Review, Expert Analysis, and Investment Recommendations

Swiggy IPO- Overview

Swiggy, one of India’s leading food delivery and hyperlocal service platforms, has officially launched its much-anticipated Initial Public Offering (IPO), marking a significant milestone in the company’s journey since its founding in 2014.  Swiggy’s IPO, valued at ₹11,327.43 crore, includes a fresh issue worth ₹4,499 crore (11.54 crore shares) and an offer for sale of ₹6,828.43 crore (17.51 crore shares). The IPO opened for subscription, with a price band set at ₹371-₹390 per share. Retail investors need a minimum investment of ₹14,820 for 38 shares, while employee allocations include a 750,000-share reservation at a ₹25 discount. Allotments will be finalized on November 11, with listing on the BSE and NSE anticipated for November 13, 2024. Founded in 2014, Swiggy is a leader in food delivery and hyperlocal services in India, with a significant presence through services like Instamart for grocery delivery, capturing a broad online market share.

IPO Subscription Period

The Swiggy IPO opensfor subscription from November 6, 2024, and will close on November 8, 2024. The finalization of the allotment is expected by November 11, 2024, with refunds being initiated the same day.

Pricing and Lot Details   

The Swiggy IPO offers an opportunity to invest in one of India’s top food and grocery delivery platforms, with the IPO open from November 6 to November 8, 2024. Key details for potential investors include:

  • Price Band: The IPO price is set between ₹371 and ₹390 per share.
  • Lot Size: Investors must purchase a minimum of 38 shares, totaling approximately ₹14,820 for retail investors at the highest price.
  • Issue Size: The IPO aims to raise around ₹11,327.43 crore, comprising a fresh issue of ₹4,499 crore and an offer for sale of ₹6,828.43 crore
  • Face Value: Rs. 1 Per Equity Share
  • The Swiggy IPO has a structured bidding system for different investor categories. Here’s a breakdown of the investment requirements for retail investors and high-net-worth individuals (HNIs):

Reservation Structure

The reservation structure for Swiggy’s IPO is divided as follows:

  • Qualified Institutional Buyers (QIBs): 75% of the issue is reserved for QIBs. This segment includes mutual funds, foreign institutional investors, and other large financial entities.
  • Non-Institutional Investors (NIIs): 10% of the issue is allocated for non-institutional investors, often high-net-worth individuals (HNIs) who invest in larger lot sizes.
  • Retail Investors: 15% of the IPO is reserved for retail investors, with a minimum bid of 38 shares per lot, allowing for smaller individual investments.
  • Employee Reservation: Swiggy has reserved up to 750,000 shares for employees, offered at a ₹25 discount per share within the IPO price band of ₹371-₹390​

This structure balances institutional and retail participation, while the employee reservation encourages internal engagement in the company’s growth.

Key Dates & Timelines

Swiggy IPO Timeline (November 2024)

  • IPO Open Date: Wednesday, November 6, 2024
  • IPO Close Date: Friday, November 8, 2024
  • Basis of Allotment: Monday, November 11, 2024
  • Initiation of Refunds: Tuesday, November 12, 2024
  • Credit of Shares to Demat Accounts: Tuesday, November 12, 2024
  • Listing Date on BSE and NSE: Wednesday, November 13, 2024

Book Running Lead Managers

The Swiggy IPO is being managed by a group of Book Running Lead Managers (BRLMs), including:

  • Avendus Capital Pvt Ltd
  • BofA Securities India Limited
  • Citigroup Global Markets India Private Limited
  • ICICI Securities Limited
  • J.P. Morgan India Private Limited
  • Jefferies India Private Limited
  • Kotak Mahindra Capital Company Limited

The registrar for the IPO is Link Intime India Private Limited, which will handle the processing of applications and allotments​

Promoters Information

Swiggy’s promoters are primarily its three co-founders: Sriharsha Majety, Nandan Reddy, and Rahul Jaimini.

  1. Anand Kripalu – Independent Director and Chairman since December 2023. He holds a B.Tech from IIT Madras, a PG Diploma from IIM Calcutta, and an advanced management program from The Wharton School. Kripalu is the Global CEO of EPL Limited and has held senior roles at Diageo’s United Spirits, Cadbury Schweppes, Hindustan Lever, and DCM Data Products. He has received the “Lifetime Achievement Award” at the Indian Marketing Awards.
  2. Sriharsha Majety – Managing Director and Group CEO of Swiggy. He holds a B.Tech from BITS Pilani and a post-graduate diploma from IIM Calcutta. With over 10 years at Swiggy, he was named ‘Entrepreneur of the Year 2019’ at The Economic Times Awards for Corporate Excellence.
  3. Lakshmi Nandan Reddy Obul – Whole-time Director and Head of Innovation at Swiggy. He holds a Master’s in Physics from BITS Pilani and has over 10 years of experience with Swiggy. Before joining the company, he worked in business consulting at Intellecap.

The major institutional investor is Prosus, a subsidiary of the South African conglomerate Naspers, which holds approximately 33-40% of the company, and is looking to reduce this shareholding through the IPO.

About Swiggy Limited.

Swiggy is a leading Indian technology-driven platform offering a variety of convenience services, including Food Delivery, Instamart for grocery delivery, Dineout for restaurant reservations, and SteppinOut for event bookings. As a pioneer in the hyperlocal commerce sector, it has quickly established itself as a leader in food delivery and quick commerce in India. The platform also includes services like Genie for product pick-up/drop-off and other hyperlocal activities.

Swiggy’s business model is enhanced by its membership program, Swiggy One, and several in-app payment solutions, including Swiggy Money, Swiggy UPI, and Swiggy-HDFC Bank credit card. The company also provides valuable services to restaurant and merchant partners through analytics-driven tools, supply chain solutions, and last-mile delivery services. By mid-2024, Swiggy employs 930 tech professionals, leveraging its technological capabilities to drive growth and operational efficiency.

The Indian food services market, which Swiggy operates within, is poised for significant growth, fueled by urbanization and rising consumer incomes. The online food delivery segment, in particular, is expected to grow from ₹640 billion in 2023 to ₹1,400-1,700 billion by 2028. Swiggy is positioning itself to capitalize on this, with a large user base in top cities and expanding reach in smaller towns. The rising Average Order Value (AOV) and increasing consumer demand for convenience further boost Swiggy’s success prospects.

Despite its strong competitive advantages, such as an innovative platform, a loyal user base, and synergies from its wide partner network, Swiggy faces challenges. These include the need to maintain user acquisition, scale operations, and address the supply-side constraints in India’s largely unorganised restaurant market. Swiggy’s strategy to overcome these risks focuses on retaining and growing its user base, expanding its partner network, and enhancing its technology infrastructure.

The company is also focused on expanding its quick commerce operations, improving brand recall, and optimizing its delivery network. However, Swiggy must address key risks, such as dependence on restaurant and merchant partners, managing Dark Stores efficiently, and overcoming the cultural preference for home-cooked food, which can limit the expansion of food services in certain regions.

IPO Objectives

The company intends to allocate the net proceeds from this issuance towards the following strategic purposes:

  1. Debt Repayment: A portion of the funds will be directed towards repaying or pre-paying some or all of Scootsy’s borrowings, thereby strengthening its overall financial position.
  2. Expansion of Dark Stores: Funds will be utilized to support the expansion of Scootsy’s Dark Store network, enhancing its ability to provide faster services in the Quick Commerce segment. This includes making necessary lease or license payments for new store locations.
  3. Technology and Infrastructure Investment: A significant portion of the proceeds will be invested in technology upgrades and cloud infrastructure, aimed at improving operational efficiency and supporting long-term business growth.
  4. Marketing and Branding: Funds will be allocated to marketing and promotional initiatives designed to increase brand awareness and expand Scootsy’s visibility across different market segments.
  5. General Corporate Purposes: The remaining proceeds will be used for general corporate purposes, allowing for flexible allocation in response to evolving business needs.

Subscription Status

Subscription Status as of 08 Nov’24’
Retail Individual Investor1.14 times
Non-Institutional Investor0.41 times
Qualified Institutional Buyers6.02 times
Employee1.65 times
Overall3.59 times

Recommendation

Swiggy is a consumer-first technology company that provides a unified platform for food delivery, grocery shopping (Instamart), and on-demand deliveries. The company’s revenue from operations for FY2024, FY2023, and FY2022 were ₹11,634.35 crores, ₹8,714.45 crores, and ₹6,119.78 crores, respectively. However, Swiggy posted negative EBITDA figures for the same periods: ₹-1,835.57 crores in FY2024, ₹-3,910.34 crores in FY2023, and ₹-3,233.76 crores in FY2022. Similarly, the Profit After Tax (PAT) was negative, with ₹-2,255.95 crores in FY2024, ₹-4,192.17 crores in FY2023, and ₹-3,631.23 crores in FY2022.

For its IPO, Swiggy is issuing shares with a pre-issue EPS of ₹-10.70 and a post-issue EPS of ₹10.07. The pre-issue P/E ratio is -36.44x, while the post-issue P/E ratio is -38.72x, significantly lower than the industry’s average of 634.50x. Additionally, the company’s Return on Equity (RoE) for FY24 is -30.16%.

The Grey Market Premium (GMP) shows no expected listing gains (0%). Given the company’s financial performance and IPO valuation metrics, we recommend avoiding Swiggy’s IPO for both short-term listing gains and long-term investments.

IRFC Q2 FY24 Results
IRFC Q2 Results: Revenue Rises 2%, Profit Up 4% YoY; Declares ₹0.8 Dividend per Share

Company Overview

Indian Railway Finance Corporation Limited (IRFC) was incorporated on December 12, 1986, as a Public Limited Company dedicated to supporting the financial needs of the Indian Railways. After receiving a Certificate of Commencement of Business on December 23, 1986, IRFC was classified as a Public Financial Institution in 1993 and later registered with the Reserve Bank of India (RBI) in 1998 as a non-banking financial institution. Over time, it evolved into a non-deposit accepting asset finance NBFC in 2008 and was subsequently reclassified as an NBFC-ND-IFC (Infrastructure Finance Company) by the RBI in 2010.

IRFC, under the administrative control of the Ministry of Railways (MoR), operates as the dedicated financing arm of the Indian Railways, securing funds from both domestic and international markets to finance its growth. Since inception, it has been crucial in funding rolling stock acquisitions and railway infrastructure projects for Indian Railways and related entities like Rail Vikas Nigam Limited (RVNL) and IRCON.

The President of India, through the MoR, holds 86.36% of IRFC’s equity, with the remaining 13.64% owned by public shareholders, highlighting the company’s strategic importance. IRFC’s primary business is to borrow funds and finance assets that are leased to Indian Railways on long-term finance leases. It focuses on acquiring rolling stock assets—such as locomotives, coaches, wagons, containers, and cranes—and leasing infrastructure projects, thus ensuring steady financing for expansion and modernization. The leasing model typically spans 30 years, divided into a primary 15-year period where IRFC recovers the principal and borrowing costs, followed by a secondary 15-year period at a nominal lease rate.

In the 2020-21 fiscal year, IRFC financed a substantial 67.43% of Indian Railways’ capital outlay (Rs. 1,55,161 crore), contributing Rs. 1,04,369 crore to infrastructure needs, highlighting its pivotal role in India’s rail infrastructure. Notably, IRFC also supports initiatives like the Gati Shakti Multi-Modal Cargo Terminal (GCT) policy, launched in December 2021 to develop additional terminals for rail cargo, further solidifying its role in india’s logistics and transport infrastructure. Over three decades, IRFC has been instrumental in enabling capacity enhancement for the Indian Railways, helping the organization keep pace with India’s growing transportation demands.

Industry Outlook

India’s rail network is advancing at an unprecedented pace, positioning it to become the third-largest rail network globally in the next five years, with a projected 10% share of the global rail market. Two pivotal government initiatives are set to drive private investments: private passenger trains operated by private entities across the network and a comprehensive railway station redevelopment program.

These initiatives are anticipated to attract over US$ 7.5 billion in private investment in the coming five years. Under the National Infrastructure Pipeline (NIP), Indian Railways has allocated more than ₹13.67 lakh crore for investment by 2025, accounting for 12% of the total planned infrastructure investment. The Draft National Rail Plan further envisions ₹38.22 lakh crore in capital expenditure for the rail sector by 2050. With the introduction of the semi-high-speed Vande Bharat trains, Indian Railways aims to operate 75 trains over 10-12 lakh kilometers by 2025-26.

The government’s focus on infrastructure is fueling railway development, with an ambitious plan to invest ₹50 lakh crore (US$ 715.41 billion) by 2030. This emphasis, coupled with favorable policy frameworks, is expected to encourage participation from both domestic and International private players, further boosting passenger and freight transport and supporting long-term sector growth.

Business Segments

Indian Railway Finance Corporation (IRFC) continues to focus on several key business segments that align with its role as the financial backbone of Indian Railways. These segments are as follows-

  • Rolling Stock Financing: This is IRFC’s largest business segment, primarily dedicated to funding the procurement of rolling stock assets like locomotives, passenger coaches, and wagons. By supporting Indian Railways in addressing the growing transportation demand, IRFC plays a crucial role in capacity enhancement across the network.
  • Railway Infrastructure Projects: IRFC finances essential infrastructure projects, including dedicated freight corridors, multi-modal logistics parks, and station redevelopment. These efforts align with the National Infrastructure Pipeline (NIP) to strengthen logistics and connectivity nationwide, supporting economic and industrial growth.
  • High-Speed Rail Corridors and Modernization: A critical area for IRFC is the funding of high-speed and semi-high-speed rail projects. The Vande Bharat trains and other initiatives aim to establish multiple high-speed corridors by FY26, significantly reducing travel time on key routes. IRFC ensures timely funding for these transformative projects.
  • Energy and Green Projects: With sustainability as a priority, IRFC supports green energy initiatives within Indian Railways, including solar and wind power installations along rail networks. These projects align with the Indian Railways’ goal of achieving a net-zero carbon footprint by 2030, advancing India’s commitment to environmental sustainability.
  • Joint Ventures and Special Purpose Vehicles (SPVs): IRFC collaborates through joint ventures and SPVs with state entities and private players to enhance freight and passenger capabilities. These projects leverage public-private partnership (PPP) models to create backward and forward linkages within Indian Railways, boosting efficiency and innovation.

Through these key segments, IRFC strategically supports the modernization and expansion of Indian Railways, contributing significantly to national infrastructure goals and promoting a sustainable rail network.

Key Subsidiaries and Their Information

As of FY25, Indian Railway Finance Corporation (IRFC) continues to operate without any major subsidiaries directly associated with its core business operations. However, IRFC collaborates closely with various entities, particularly in public-private partnership (PPP) arrangements and special-purpose vehicles (SPVs), aimed at enhancing rail infrastructure projects and rolling stock for Indian Railways. These partnerships align IRFC with infrastructure development initiatives, especially as the government prioritizes rail network expansion and modernization across India.

Q2 FY25 Highlights

  • Revenue from Operations has been ₹6,899 crore, marking a 2% YoY increase. Net Profit (PAT) of ₹1,612 crore, showing a 4% YoY growth from ₹1,544 crore in Q2 FY24.
  • Operating Profit of ₹1,650.6 crore, reflecting a 4.5% YoY increase from ₹1,579.53 crore. Total Expenses stood at₹5,287.55 crore, reflecting a slight 1% rise compared to ₹5,217.60 crore in Q2 FY24.
  • IRFC’s net worth increased to ₹51,464.12 crore in Q2 FY25, a significant rise from ₹46,883.22 crore in the same quarter of FY24, reflecting the company’s improved financial position. The debt-equity ratio stood at 7.83 in the September 2024 quarter, down from 8.67 in Q2 FY24, indicating a slight reduction in leverage and improved financial stability.
  • Indian Railway Finance Corporation (IRFC) has set November 12, 2024, as the record date to determine the shareholders who are eligible for the interim dividend. This means that shareholders registered as of this date will be entitled to receive the interim dividend declared by the company.
  • The IRFC Board has approved the financing of 20 Bogie Open Bottom Rapid (BOBR) rakes under the General-Purpose Wagon Investment Scheme (GPWIS) of the Ministry of Railways (MoR) to NTPC for up to ₹700 crore under a Finance Lease. IRFC has entered into Memoranda of Understanding (MoUs) with RITES and IIFCL to form strategic collaborations aimed at enhancing its operational and financing capabilities for future railway projects.

Financial Summary

SWOT Analysis

Strengths:

  1. Strategic alignment with Indian Railways
  2. Strong government backing
  3. Expanding asset portfolio
  4. Solid market presence

Weaknesses:

  1. High debt burden
  2. Limited revenue sources
  3. Sensitivity to operating margins

Opportunities:

  1. Infrastructure growth
  2. Private sector collaborations
  3. Adoption of new technology
  4. Green financing potential

Threats:

  1. Regulatory compliance demands
  2. Rising competition
  3. Economic and geopolitical risks
  4. Interest rate fluctuations
Dabur India Q2 earnings
Dabur Q2 Results: 17.5% YoY Drop in Net Profit to ₹425 Cr, Announces ₹2.75 Interim Dividend

Company Overview

Dabur India Ltd. is a prominent Indian consumer goods company with a strong portfolio in the fast-moving consumer goods (FMCG) sector, particularly in health, wellness, and personal care products. Established in 1884, Dabur has become a trusted household name and is recognized for its Ayurvedic and natural product offerings, catering to a broad spectrum of customer needs across India and over 100 international markets. Ayurveda-based healthcare is Dabur’s core strength. The brand’s portfolio includes products such as Dabur Chyawanprash, Dabur Honey, Dabur Honitus, and Dabur Lal Tail, which are deeply rooted in Ayurvedic formulations. The company has acquired 51% stake in Badshah Masala.

Industry Outlook

The FMCG sector has witnessed a significant shift toward health, wellness, and immunity-boosting products, accelerated by the COVID-19 pandemic. Consumers are increasingly seeking products with natural ingredients and Ayurvedic formulations for both preventive and curative healthcare. The FMCG sector in India is benefiting from expanding consumer spending in both urban and rural areas. Rising disposable incomes, population growth, and increasing awareness of branded, quality products have fuelled FMCG demand. The demand for personal care items free of chemicals, synthetic ingredients, and additives is expected to grow, allowing Dabur to expand its market share in segments such as oral care, skin care, and hair care.

Business Segments

  • Health Care: It includes many product categories in its portfolio like Dabur Chyawanprash, Honey, Pudin Hara, Dabur Lal Tail, etc. which is huge brands in India and they all are used for consumers’ health benefits and healthy routines. This segment is a core business contributes about 31-35% of Dabur’s revenue.
  • Personal Care: It is used by many consumers as daily routine for their personal care, the products like Dabur Amla, Dabur Red Paste, and Vatika. And there are other international brands of Dabur which has presence outside India for personal care, oral care, skin or hair care, etc.
  • Food & Beverages: This segment includes a very popular packaged soft drink brand called Real, its yearly turnover is more than ₹1000 crore. And the Badshah Masala brand, which is a huge private company is acquired 51% stake for ₹590 crore.
  • Geography: The international business accounts for almost 25% revenue of the company. The geography distribution of International market is Middle East- 24%, Africa- 24%, Europe- 15%, America- 15% and Asia-22%.

Quarterly Highlights

  • Revenue of ₹3029 crore in Q2 FY25 down by 6.54% YoY from ₹3204 crore in Q2 FY24.
  • EBITDA of ₹553 crore in this quarter at a margin of 18% compared to 21% in Q2 FY24.
  • Profit of ₹418 crore in this quarter compared to a ₹507 crore in Q2 FY24.

Business Highlights

  • The heavy monsoon and flooding impacted the beverage category in this quarter, but edible oils and ghee have grown by 70% and the Badshah has continued its growth with the gains in market share.
  • UAE and Egypt saw a strong double digit growth, so Dabur is investing in capacity expansion to service increased demand.
  • Winter season is great for the company as its many products are related and beneficial to use in this particular season like Chyawanprash products, Honey, Oils, etc. which will increase their quarterly revenue.
  • Dabur has merged Sesa Care Private Ltd with annual turnover of ₹133 crore, which can help Dabur premiumize the Ayurvedic portfolio to attract higher margins.

Financial Summary and Key Ratios

SWOT Analysis

Strengths:

  1. Established brand with a strong legacy
  2. Diverse and comprehensive product portfolio
  3. Extensive and well-established distribution network

Weaknesses:

  1. Limited presence in developed markets
  2. Fluctuating raw material costs
  3. Exposure to regulatory risks

Opportunities:

  1. Growth potential in Tier 2 and Tier 3 markets
  2. Opportunities for product innovation and premium offerings
  3. Expansion into international markets
  4. Rising demand for Ayurvedic and natural products

Threats:

  1. Intense competition in the industry
  2. Risk of counterfeit or imitation products
  3. Vulnerability to economic downturns
Tata power Q2 earnings
Tata Power Q2 Results: Net Profit Surges 51% YoY to ₹1,533 Crore

Company Overview

Tata Power Company Limited is India’s largest integrated private power company, with a significant global presence and a legacy spanning over a century. With an installed generation capacity of 6,075 MW in India, Tata Power actively engages across all segments of the power sector, including Generation, Transmission, Distribution, Power Trading, and Power Services. The company has been a pioneer in India’s power industry, establishing numerous thermal and hydro plants since its founding in 1919. Tata Power’s historic milestones include India’s first 500 MW multi-fuel generating unit at Trombay in 1984 and successive expansions into renewable energy sources such as wind and solar. As of March 31, 2022, Tata Power’s installed capacity reached 13,515 MW, with approximately 34% derived from clean energy sources.
In the renewable energy sector, Tata Power is among India’s largest players. It developed the country’s first Ultra Mega Power Project of 4,000 MW at Mundra in Gujarat, based on super-critical technology. Tata Power also operates a diverse range of consumer-facing businesses, including solar rooftop installations, solar pumps, EV charging infrastructure, and home automation solutions. Through Tata Power Renewable Energy (TPREL), it acquired Welspun Renewables Energy, a leading solar portfolio in India, comprising approximately 1,140 MW in renewable projects.
Recently, Tata Power’s strategic expansions have included distribution network acquisitions in Odisha, the installation of microgrids, and smart energy solutions with IoT-based home automation tools. In 2023, Tata Power, through Resurgent Power Ventures, acquired NRSS XXXVI Transmission Limited and South East U.P. Power Transmission Company Limited, further strengthening its transmission assets and reinforcing its position in India’s evolving power landscape.

Industry Outlook

The energy industry outlook for FY25 and beyond is robust, driven by accelerating demand for renewable energy, supportive government policies, and a growing interest from industries and consumers in sustainable solutions. India’s power sector is undergoing a significant transformation, targeting 500 GW of renewable capacity by 2030. This ambitious goal creates vast opportunities for companies like Tata Power to expand their solar, wind, and hybrid capacities. Solar and wind energy are set to lead this transition, supported by cost reductions, increased efficiencies, and policy incentives. The government’s Production-Linked Incentive (PLI) schemes and focus on domestic manufacturing are expected to enhance the renewable supply chain, thereby decreasing reliance on imports for critical components such as solar cells and modules. This aligns perfectly with Tata Power’s mphasis on solar manufacturing and internal capacity expansion, positioning the company to benefit from both domestic demand and export opportunities.
Tata Power’s outlook remains strong, driven by aggressive renewable energy expansion and operational stability. The company is enhancing its solar manufacturing capabilities with a 4.3 GW facility, targeting an annual run rate of 2-2.5 GW in solar capacity while focusing on utility-scale and rooftop projects. In transmission and distribution, Tata Power is advancing critical projects with an EPC order book valued at ₹15,000 crore, including the Bhivpuri Pumped Storage Project, which is expected to boost long-term revenue by FY29.
Additionally, its Delhi distribution network benefits from a regulatory asset liquidation plan, improving cash flows. Despite temporary disruptions at the Mundra coal plant, Tata Power has shown resilience and high operational availability.

Business Segments

Tata Power operates through several key business segments that contribute to its overall growth and diversification in FY25. Here are the primary business segments:

  1. Renewable Energy:
  2. Solar Power: Tata Power has made significant investments in solar energy, with a focus on expanding its solar generation capacity. The company aims for an annual run rate of 2-2.5 GW in solar capacity, focusing on utility-scale and rooftop solar projects.
  3. Wind Power: Tata Power continues to enhance its wind energy portfolio, contributing to its overall renewable capacity. The company is committed to increasing its wind energy output as part of its sustainability initiatives.
  4. Hybrid Projects: Tata Power is developing advanced hybrid projects that combine solar, wind, and energy storage solutions. These projects are designed to optimize energy production and enhance overall efficiency.
  5. Conventional Power Generation:
  6. This segment includes the generation of electricity through coal and natural gas. Tata Power’s Mundra coal plant is a significant contributor to this segment, although it faced temporary operational disruptions due to adverse weather conditions.
  7. Transmission and Distribution:
  8. Tata Power is actively involved in expanding and enhancing the transmission and distribution of electricity across India. This includes several critical projects, such as high-voltage transmission lines and pumped hydro projects. The company is focused on improving grid reliability and expanding its network to meet growing energy demand.
  9. EPC (Engineering, Procurement, and Construction):
  10. Tata Power provides EPC services for various projects, particularly in the renewable energy sector. The company’s current EPC order book is valued at ₹15,000 crore, reflecting its strategic focus on internal project execution over third-party work. This approach aims to maximize operational efficiency and resource allocation.
  11. Electric Vehicle (EV) Infrastructure:
  12. Tata Power is expanding its footprint in the electric mobility sector by investing in EV charging infrastructure. The company is well-positioned to capitalize on the growing demand for EVs in India, which will drive increased energy consumption and grid enhancements.

Key Subsidiaries and Their Information

Here are some of its prominent subsidiaries and their functions:

  • Tata Power Renewable Energy Limited (TPREL) is a cornerstone of Tata Power’s strategy to aggressively expand its renewable energy portfolio. Specializing in solar and wind power generation, TPREL plays a vital role in helping Tata Power meet its ambitious renewable energy targets. Recently, TPREL has been increasing its solar and wind capacity across India, furthering the company’s commitment to achieving a fully renewable future.
  • Another significant subsidiary is Tata Power Solar Systems Limited, which focuses on manufacturing solar panels and providing EPC (Engineering, Procurement, and Construction) services for large solar projects. Tata Power Solar is crucial to Tata Power’s solar expansion plans, both for utility-scale and rooftop projects. The subsidiary is enhancing its production capabilities with a new 4.3 GW manufacturing facility, which will support Tata Power’s growth ambitions in the solar sector.
  • On the distribution side, TP Ajmer Distribution Limited is responsible for electricity distribution in Ajmer, Rajasthan. As part of Tata Power’s push to strengthen its distribution network, this subsidiary has been focused on modernizing infrastructure and improving service quality. Similarly, Tata Power Delhi Distribution Limited (TPDDL) is a key distribution subsidiary serving parts of Delhi. Known for its operational efficiency, TPDDL benefits from a regulatory asset liquidation plan that is expected to enhance cash flows and strengthen financial performance.
  • Maithon Power Limited contributes to Tata Power’s thermal power generation, operating a coal-based power plant that supplies electricity to the grid, thus ensuring a balanced energy portfolio. Although Tata Power has a strong renewable focus, Maithon Power provides stability and a reliable power supply within the company’s generation mix.
  • Tata Power has also made significant inroads in Odisha with TP Central Odisha Distribution Limited, TP Western Odisha Distribution Limited, TP Southern Odisha Distribution Limited, and TP Northern Odisha Distribution Limited. These subsidiaries focus on improving power distribution across various regions of Odisha, where Tata Power aims to enhance reliability and service quality in historically underserved areas.
  • Walwhan Renewable Energy Limited is another critical player in Tata Power’s renewable portfolio, managing a range of solar and wind assets across India. This subsidiary contributes substantially to Tata Power’s overall green energy capacity, supporting its shift toward renewable sources.
  • Trust Energy Resources Pte. Limited, based in Singapore, plays a supportive role by managing fuel logistics and securing fuel for Tata Power’s thermal plants, thus ensuring steady operations at its coal-based facilities.
  • Tata Power EV Charging Solutions Limited drives the company’s push into the electric vehicle infrastructure sector. As the demand for EVs in India grows, this subsidiary has been actively expanding Tata Power’s EV charging network nationwide, establishing the company as a leading player in India’s nascent but rapidly growing EV ecosystem.

Together, these subsidiaries underscore Tata Power’s multi-faceted approach, blending renewable expansion, efficient distribution, EV infrastructure development, and reliable thermal generation to create a sustainable and resilient energy business.

Q2 FY25 Highlights

  • Revenue: Q2 FY25 revenue saw a marginal 1% YoY decline (₹15,247 crore vs. ₹15,442 crore in Q2 FY24), indicating stable demand but possibly some short-term challenges. However, H1 FY25 revenue grew by 5% YoY (₹32,057 crore vs. ₹30,446 crore in H1 FY24), reflecting steady growth over the half-year.
  • EBITDA Growth: Tata Power achieved impressive 23% YoY EBITDA growth in Q2 FY25 (₹3,808 crore vs. ₹3,087 crore in Q2 FY24) and 17% YoY growth in H1 FY25 (₹7,158 crore vs. ₹6,092 crore in H1 FY24). This improvement suggests enhanced operational efficiency and cost management, as well as possibly favorable contributions from higher-margin business segments.
  • Profit After Tax (PAT): PAT increased substantially by 51% YoY in Q2 FY25 (₹1,533 crore vs. ₹1,017 crore in Q2 FY24) and by 41% YoY in H1 FY25 (₹2,721 crore vs. ₹1,924 crore in H1 FY24). This robust growth in profitability, despite flat revenue, indicates strong financial health, likely driven by effective cost control, better pricing strategies, and growth in high-margin segments.
  • Robust Order Book: Solar EPC business has a well-diversified order book of ₹15,900 crore.
  • Installed Capacity Growth: Total installed generation capacity surpassed 15 GW, with a clean and green portfolio of ~12.9 GW (6.4 GW operational, 6.5 GW under construction).
  • Expanding Transmission Portfolio: Transmission assets now cover 7,049 CKm, with 4,633 CKm commissioned and 2,416 CKm under construction.
  • Consistent Profit Growth: Achieved its 20th consecutive quarter of PAT growth.
  • Significant Capex Investment: Incurred ₹5,200 crore in Q2FY25 and ₹9,100 crore in H1FY25 towards growth, targeting a full-year capex of ~₹20,000 crore.
  • S&P Global upgraded Tata Power’s rating to BBB-/Positive from BB+/Stable.
  • Added 62 bus chargers and over 11,500 home chargers this quarter.
  • Signed an MoU with Tata Motors to establish 200 fast-charging stations for electric commercial vehicles in major metropolitan cities across India.
  • Tata Power’s market cap has exceeded ₹1.5 trillion.

Financial Summary

INR in Cr.Q2FY25Q1FY25Q2FY24Q-o-Q GrowthY-o-Y Growth
Total Revenue15,69817,29415,738-9.23%-0.26%
Selling General Admin Expenses (Total)1,0411,0149952.67%4.61%
Depreciation/ Amortization9879739261.42%6.57%
Total Operating Expense13,53015,16413,869-10.77%-2.44%
Operating Income2,1682,1301,8691.78%15.96%
Net Income Before Taxes1,7731,4901,23118.96%44.06%
Net Income927971876-4.57%5.83%
Diluted Normalized EPS3.173.032.744.63%15.70%

SWOT Analysis

Strengths:

  1. Robust Renewable Portfolio – Strong presence in the renewable energy sector.
  2. High Profitability and Financial Growth – Consistent financial performance and profitability.
  3. Diverse Order Book – A wide range of projects contributing to stability.
  4. Strong Brand and Legacy – Established reputation and trust in the industry.

Weaknesses:

  1. High Debt Levels – Significant debt may pose financial risks.
  2. Dependence on Coal Assets – Reliance on coal could impact sustainability efforts.
  3. Complex Subsidiary Structure – Multiple subsidiaries may complicate management and oversight.

Opportunities:

  1. Expansion in Renewable Energy – Potential for growth in the renewable sector.
  2. Growing EV Infrastructure – Increasing demand for electric vehicle infrastructure presents new avenues for growth.
  3. Government Support for Green Initiatives – Favorable policies and support for green initiatives enhance growth prospects.
  4. Global Expansion – Opportunities to enter new markets internationally.

Threats:

  1. Regulatory and Environmental Compliance – Navigating complex regulations can be challenging.
  2. Competitive Market – Intense competition in the energy sector may impact market share.
  3. Economic and Geopolitical Risks – External factors may affect operational stability.
  4. Interest Rate Volatility – Fluctuating interest rates could impact financing and investment costs.
Narayana Hrudayalaya Q2 Results
Narayana Hrudayalaya Q2 Results: Revenue Growth Despite 12.3% Decline in Net Profit

Company Overview

Narayana Hrudayalaya Ltd. (also known as Narayana Health) is one of India’s leading healthcare providers, headquartered in Bengaluru, Karnataka. Founded in 2000 by renowned cardiac surgeon Dr. Devi Prasad Shetty, the company has grown into a comprehensive healthcare network with a strong focus on affordable and accessible care. Narayana Health specializes in high-quality tertiary and quaternary care across a range of specialties, particularly in cardiology and oncology. Narayana Health operates over 20 hospitals and 7 heart center across India, with a strong presence in both urban and semi-urban areas. The company also has an international hospital in the Cayman Islands.

Industry Outlook

The Indian healthcare industry was valued at approximately $280 billion in 2022 and is projected to reach $532 billion by 2028, growing at a CAGR of around 10-12%. The government’s PLI scheme for the pharmaceutical and medical device industries aims to boost local production and reduce dependence on imports, potentially lowering healthcare costs in the long term. India faces a shortage of hospital beds, with about 1.3 beds per 1,000 people, below the WHO recommendation of 5. While there is progress, addressing this gap, especially in rural areas, remains a priority. About 70% of India’s population lives in rural areas but has limited access to healthcare. Expanding healthcare facilities in these areas and increasing the availability of affordable care are crucial for balanced sector growth.

Business Mix

  • Owned Hospitals: Its where company owns the hospitals and operates the patients and handle their works. It contributed ₹817 crore in Q2 FY25 revenue of the company.
  • Operated Hospitals: It has a portfolio of hospitals where it does not own them but operates in it. It has contributed about ₹315 crore in this quarter.
  • Heart Centers: The Company has its own Heart center in India, where it treats the patients with their extraordinary skills. It has contributed ₹17.5 crore for Q2 FY25.
  • Other Ancillary Business: It provides equipments to other hospitals for surgery or other operations to perform. It earned a revenue of ₹17 crore this quarter.
  • Specialty Profile: It includes the treatment and facilities of Cardiac Science, Oncology, Neuro Sciences, Medicines and GI sciences, renal sciences, Orthopedics and others, in their hospitals.

Quarterly Highlights

  • Revenue of ₹1167.7 crore in Q2 FY25 up by 10.9% YoY from ₹1052.7 crore in Q2 FY24.
  • EBITDA of ₹308 crore in this quarter at a margin of 22% compared to 24% in Q2 FY24.
  • Profit of ₹199 crore in this quarter compared to a ₹227 crore in Q2 FY24.
  • Domestic revenue is ₹1081.6 crore up by 13.5% YoY & International revenue is ₹76.2 crore down by 19.2% YoY.

Business Highlights

  • The patient footfalls including day care business is 710,000 in Q2 and the Average revenue per Patient is ₹135,000.
  • Narayana Health has total 40 facilities & 5789 operational beds, from which 2 facilities and 128 beds for Heart centers.
  • The capex of ₹534 crore is expected for FY25. The capex is used for Facility Improvement, medical equipment purchase and new investment in Land, hospital constructions and clinics, etc.

Financial Summary and Key Ratios

SWOT Analysis:

Strengths

  1. Affordable Healthcare Model – Known for providing cost-effective healthcare solutions.
  2. Extensive Network – A broad reach that enhances accessibility for patients.
  3. Specialized Expertise – Strong focus on specialized medical services and treatments.
  4. Reputable Brand – Trusted brand with a strong reputation in the healthcare industry.

Weaknesses

  1. Geographical Limitations – Presence concentrated in specific regions, limiting reach.
  2. Low Profit Margins – Cost-focused model results in slimmer profit margins.
  3. High Operational Expenses – Substantial running costs impact overall profitability.

Opportunities

  1. Expansion into Tier 2 & 3 Cities – Opportunity to grow in emerging urban areas with increasing healthcare needs.
  2. Rising Demand for Healthcare – Growing population and healthcare awareness drive demand.
  3. International Growth – Potential to expand services globally and tap new markets.
  4. Focus on Wellness Services – Increasing interest in wellness services opens new revenue channels.

Threats

  1. High Competition – Competing with numerous healthcare providers for market share.
  2. Changing Regulations – Frequent shifts in healthcare regulations create operational challenges.
  3. Economic Uncertainty – Economic downturns can reduce patient spending on non-essential healthcare services.

Vardhaman Textiles Q2 Results
Vardhaman Textiles Q2 Results: Profit Soars 46.57% Year-on-Year

Company Overview

Vardhman Textiles Ltd. is one of India’s largest textile manufacturers, recognized for its integrated operations in yarn, fabric, and garment production. Established in 1965 and headquartered in Ludhiana, Punjab, Vardhman has grown into a vertically integrated textile conglomerate with a diverse product range. The company caters to both domestic and international markets, supplying a variety of textile products to some of the world’s leading brands. The clientele lists are GAP, H&M, Walmart, Calvin Klein, Tommy Hilfiger, etc. It is presented in 57 countries.

Industry Outlook

The global textile market was valued at approximately $1 trillion in 2022 and is projected to grow at a CAGR of around 4.4%, reaching $1.35 trillion by 2027. Valued at around $150 billion in 2022, the Indian textile and apparel market is expected to reach $250 billion by 2025 at a CAGR of 10%. Increasing disposable incomes, e-commerce expansion, and demand from emerging markets drive this growth. Rising demand for apparel, home textiles, and technical textiles are also key contributors. Many global brands are shifting sourcing away from China to South Asian countries. India, Bangladesh, and Vietnam are key beneficiaries, with India’s textile exports to the US and EU increasing by over 15% annually. Challenges such as raw material price volatility and energy costs remain, necessitating efficient resource management and technology adoption for sustained growth.

Segment Information

  • Yarn: Yarn segment includes ranges of specialised greige, dyed and recycled sustainable yarns in various materials like cotton, polyester, acrylic, viscose, and specialized fibres, along with blends. This diverse portfolio allows us to cater to a wide array of customer requirements. In this quarter Yarn segment earned revenue of ₹2454 crore. It sold about 68,461 metric tons of Yarn this quarter.
  • Fabrics: We specialize in manufacturing fabrics suitable for tops, bottoms and outerwear across kids, men and women categories. Our capabilities extend to piece-dyed, yarn-dyed and printed fabrics, catering to both casual and formal wear. Our facilities feature a mix of advanced European and Japanese machinery and technologies, enabling us to handle a vast range of products from 60 GSM to 400 GSM.
  • Garments: Vardhman Apparels outlook has always been to satisfy our customers with high quality shirts with our state of the art infrastructure and equipments accompanied by our innovative product that we offer our customers as a futuristic approach. To produce world class garments both for the international and domestic brands, offering wide range of products in all blends. It had earned revenue of ₹112 crore in FY24.

Quarterly Highlights

  • Revenue of ₹2502 crore in Q2 FY25 up by 4.38% YoY from ₹2397 crore in Q2 FY24.
  • EBITDA of ₹315 crore in this quarter at a moderate margin of 13% compared to 9% in Q2 FY24.
  • Profit of ₹197 crore in this quarter compared to ₹136 crore in Q2 FY24.

Business Highlights

  • Bangladesh is the second largest exporter player for India and even though there were issues with Bangladesh, the company’s sales or exports were not affected much and financials were remained at same levels.
  • Cotton prices are at lower side of $0.6, and the company has exhausted its inventory so it has started buying cotton from market in Q1 and start of Q2 FY25 at lower prices.
  • The EBITDA and profitability margins are in downward trend for many years and it is a negative signs as the company’s clients are reliable and strong, the sales are growing but the profits are remaining same.

Financial Summary and Ket Ratios

SWOT Analysis of Vardhaman Textiles

Strengths:

  1. Strong market position in the textile industry.
  2. Wide range of products.
  3. Focus on sustainability and eco-friendly practices.

Weaknesses:

  1. Fluctuating raw material prices.
  2. Limited B2C presence.
  3. Heavy reliance on exports.

Opportunities:

  1. Government incentives and support.
  2. Growth through e-commerce channels.
  3. Shifts in global supply chains.

Threats:

  1. Intense market competition.
  2. Economic downturns.
  3. Tightening environmental regulations.
  4. Currency exchange rate volatility.

Sterlite-Technologies-Q2
Sterlite Technologies Q2: ₹14 Crore Loss, 5.42% Revenue Drop

Company Overview

Sterlite Technologies Limited (STL) is a global leader in end-to-end data network solutions. The company designs and deploys high-capacity fiber cables and wireless networks, collaborating with telecom companies, cloud providers, citizen networks, and enterprises to build and manage cloud-native networks. Founded in 2000 after a demerger from Sterlite Industries, STL has expanded its manufacturing presence across Aurangabad, Pune, Silvassa, and Haridwar. Since its inception, STL has advanced through innovation and strategic acquisitions. In the early 2000s, it significantly increased fiber optic and copper cable capacities and launched several broadband and network access products. STL was recognized as one of India’s fastest-growing technology companies.
The company’s global reach expanded through acquisitions, including stakes in Sterlite Infrastructure, Jiangsu Sterlite Tongguang Fiber (China), and Sterlite Conduspar (Brazil). In 2015, it acquired the power transmission business and later demerged it as Sterlite Power Transmission Ltd. in 2016. From 2018 to 2023, STL acquired Metallurgica Bresciana (Italy), IDS Group (UK), and Optotec S.p.A. (Italy), bolstering its role in data networks and optical products. In 2022, STL streamlined its portfolio by divesting assets like IDS Group and telecom software business. The launch of Fiber-to-the-Room (FTTR) services in 2023 reinforces its commitment to delivering high-speed data infrastructure solutions globally.

Industry Outlook

The fiber optics and data network solutions sector is set for robust growth in FY25, driven by the rising global demand for high-speed connectivity, propelled by 5G, AI, IoT, and expanding data centers. Sterlite Technologies Limited (STL) has a promising outlook with multiple key growth drivers across its core markets and product lines. STL anticipates sustained demand for fiber as global clients continue to expand network infrastructure. Analysts project a solid 7% demand growth (excluding China) in the coming years, with North America and India expected to see accelerated growth. With the rapid rise of AI and data centers, STL is well-positioned to benefit from increased fiber requirements. Modern, GPU-dense data centers need up to 36 times more fiber than traditional CPU-based centers. STL’s focus on compact, high-density optical fiber solutions provides 70% more fiber per unit than standard installations, targeting this specific need. The company aims to capture a share of the $5.7 billion investment anticipated in the data center market. At IMC 2024, STL launched its AI-DC portfolio, supporting the “Make in India” initiative and addressing the increasing demand for advanced data center infrastructure. STL is targeting 25% of its revenue from data center and enterprise products in the medium term, aligning with its strategy to leverage the AI and data revolution. Additionally, a growing emphasis on sustainable, energy-efficient infrastructure, in line with ESG standards, is shaping the sector. Increased investments in digital infrastructure and advanced network solutions are expected to propel growth, benefiting companies like STL.

Business Segments

Sterlite Technologies Limited (STL) operates across several core business segments, focusing on comprehensive data network and digital infrastructure solutions.

  • Optical Fiber and Cable Solutions: STL is a leading provider of high-capacity optical fiber cables and solutions, essential for telecom and network infrastructure. This segment includes high-density, compact fiber cables, which cater to growing data demands, particularly in 5G networks and data centers.
  • Network Services: STL offers network design, deployment, and maintenance services for telecom operators, cloud companies, and large enterprises. This segment focuses on building and managing end-to-end network infrastructure, including wireless networks, fiber-to-the-home (FTTH), and other network expansions.
  • Data Center Solutions: This segment includes STL’s newly launched AI-DC (Artificial Intelligence-Data Center) portfolio, which supports the increasing data needs of modern, GPU-dense data centers. STL provides high-density fiber solutions specifically designed for data centers, aiming to capture a significant share of the growing data center market.
  • Enterprise Network Solutions: STL serves various enterprises by providing tailored digital network solutions, including cloud-native, software-defined networks, which help optimize network performance and scalability for corporate clients.
  • Digital and System Integration: STL’s digital and integration services support clients in deploying and managing advanced network solutions, integrating software-defined networking (SDN), network function virtualization (NFV), and cloud infrastructure.
  • Sustainability and ESG-Focused Solutions: STL incorporates energy-efficient, sustainable infrastructure solutions across its offerings, aligning with Environmental, Social, and Governance (ESG) standards.

Key Subsidiaries and Their Information

Sterlite Technologies Limited (STL) has a global footprint with several key subsidiaries that support its operations in network solutions, digital transformation, and manufacturing across various regions. Here are some of its prominent subsidiaries and their functions:

  • Sterlite Tech Cables Solutions Limited – A core subsidiary focused on manufacturing advanced fiber-optic and cable solutions, catering to STL’s global network deployment needs.
  • STL Digital Limited – Engages in digital solutions and services, playing a critical role in STL’s diversification into digital transformation and enterprise services.
  • Sterlite (Shanghai) Trading Company Limited – Supports STL’s operations and sales within China, a significant market for optical fiber and telecom solutions.
  • Sterlite Tech Holding Inc. (USA) – This U.S.-based subsidiary enables STL to expand in North American markets, providing optical and digital solutions to local clients.
  • Metallurgica Bresciana S.p.A. – An Italian subsidiary specializing in high-end optical and metal cables, acquired to bolster STL’s manufacturing capabilities and expand in Europe.
  • STL Optical Interconnect S.p.A. – Based in Italy, this subsidiary focuses on optical interconnect products essential for data centers and high-speed networks, enhancing STL’s position in advanced optical solutions.
  • Sterlite Technologies DMCC (Dubai) – Supports the Middle Eastern and African markets, aligning with STL’s global expansion strategy for network and digital solutions.
  • Clearcomm Group Ltd (UK) – Acquired to strengthen STL’s services portfolio in the UK, focusing on network deployment and management services for European clients.
  • Jiangsu Sterlite Fiber Technology Co. Ltd. (China) – A joint venture that manufactures optical fiber solutions, providing STL with a competitive edge in the Asian market.

These subsidiaries are pivotal in driving STL’s growth strategy, enhancing its capabilities in manufacturing, digital services, and global market outreach.

Q2 FY25 Highlights

  • In Q2 FY25, Sterlite Technologies Limited (STL) reported a revenue of INR 1,413 crore. While optical fiber cable (OFC) volumes decreased on a year-on-year basis, there was an improvement in both volumes and revenues when compared quarter-on-quarter. This reflects a positive trend despite the annual decline in volumes.
  • EBITDA margin of 10.7%. This decline in margins was attributed to lower optical fiber cable (OFC) volumes on a year-on-year basis. However, there was a positive shift, with improved margins observed when comparing quarter-on-quarter performance. This indicates a recovery in operational efficiency despite the annual volume challenges.
  • Company reported PAT (Profit After Tax) loss of INR 13 crore, showing improvement as losses reduced on a quarter-over-quarter basis. This indicates the company is making progress, likely through cost optimizations or revenue improvements, signaling a move towards profitability.
  • As of H1 FY25, the company’s Net Debt stands at INR 2,169 crore, with a Debt-to-Equity ratio of 0.74. This ratio reflects the company’s current leverage and financial stability at the mid-year mark.
  • Sterlite Technologies Limited (STL) has secured large orders from a leading American customer and a major UK telecom operator for optical connectivity and fiber solutions. Additionally, the company is working with an Indian private telecom player to enable Fixed Wireless Access (FWA) deployment, alongside securing long-term contracts for fiber cable supply from another large Indian telecom provider. STL has also achieved significant deals in Italy for optical fiber cables and specialty cable products.

Financial Summary

INR in Cr.Q2FY25Q1FY25Q2FY24Q-o-Q(%)Y-o-Y(%)
Revenue*1,4131,2181,49416.01%-5.42%
EBITDA*1519321662.37%-30.09%
EBITDA %00038.96%-25.69%
Depreciation8382851.22%-2.35%
EBIT*6811131518.18%-48.09%
Finance Costs84719518.31%-11.58%
Exceptional Items
PBT* (Before share of Associates and JV)-16-603673.33%-144.44%
Tax-3-131276.92%-125.00%
Net Profit* (After minority Interest & share of JV)-13-472872.34%-146.43%
Profit (loss) from discontinued operations-1-160.00%-116.67%
Net Profit-14-483470.83%-141.18%
Diluted Normalized EPS-0.26-0.970.7173.18%-136.71%

SWOT Analysis of Sterlite Technologies

Strengths:

  • Global presence and integrated business model
  • Strong focus on innovation and R&D
  • Robust order book

Weaknesses:

  • Heavy reliance on telecom sector
  • Profitability pressures and high debt
  • Limited vertical integration in some areas

Opportunities:

  • Growth from 5G rollout and government digital initiatives
  • Rising demand for data centers and new tech diversification

Threats:

  • Intense competition and regulatory risks
  • Technological disruptions and forex fluctuations