Zomato Q2 Earnings Net Profit Jumps 389% YoY
Zomato Q2 Earnings: Net Profit Jumps 389% YoY, ₹8,500 Crore Fundraising via QIP Approved

Company Overview

Zomato ltd. is a leading Indian online food delivery and restaurant discovery platform with a market capitalization of Rs 200,000+ crore. Founded in 2008, Zomato has grown to become one of India’s most prominent food-tech companies, connecting millions of users with restaurants and delivery services across the country. It has over 17 million monthly active users all over world and 300,000+ delivery personnel. In 2022, Zomato acquired Blinkit as a subsidiary for approx. Rs 4440 crore. It specializes in quick commerce for fast delivering groceries, etc.

Industry Outlook

The Indian e-commerce food delivery industry is poised for strong growth in FY25, driven by increasing consumer demand, digital adoption, and expansion into Tier 2 and Tier 3 cities. Indian food delivery market is expected to grow at a CAGR of 18-20% over the next few years, reaching an estimated ₹1 trillion by FY25. This trend is expected to continue, with more people opting for the convenience of ordering in.

Segmental Information

  • Food Delivery: It is a food ordering and delivery platform where customers can search and discover local restaurants, order food, and have it delivered reliably and quickly and it is a core segment of this company.
  • Quick Commerce: It offers a quick delivery services to its customers for various categories of products like stationery, fruits, foods, merchandise, electronics item, etc. in delivery time of 15 minutes. And it has acquired a subsidiary called Blinkit, which handles this segment for Zomato.
  • Going Out: This segment is a combination of Dining out & ticketing platform where it offers customers to discover a restaurant and reserve it for them and customers can book tickets also for movies or any live shows, etc.
  • B2B Supply: The B2B business (Hyper pure) is that, supplying quality food ingredients and other products to restaurants and other B2B buyers.

Q2 FY25 Highlights

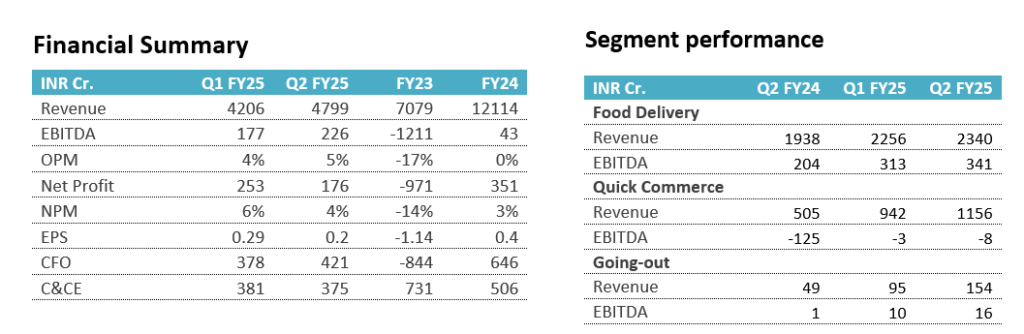
  • Bottom line (EBITDA) continued to improve steadily and Quick commerce business is now near a break-even point.
  • Zomato has proposed a fund raising via QIP.
  • Food delivery GOV grew 21% YoY (5% QoQ), Quick commerce GOV grew 122% YoY (25% QoQ) and Going-out GOV grew 171% YoY (46% QoQ); total GOV grew 139% YoY (29% QoQ).
  • The new District app for going-out business will be live soon in Q3.
  • Zomato had average monthly of 20.7 million customers, 292,000 restaurant partners and 500000 delivery partners.

Subsidiary- Blinkit

  • It had revenue of Rs 1156 crore compared to 942 crore in Q2FY24, a growth of 129% YoY.
  • EBITDA was at break-even level of Rs -8 crore in Q2 FY25 which was Rs -125 crore a year back. Shows a good sign.
  • GOV for quick commerce business was Rs 6132 crore and orders for Q2 FY25 were 92.9 million and its average order value is Rs 660, as it offer low price products for daily use and fast delivery.
  • The total stores for Blinkit till Q2 are 791 stores and 152 stores were added during this quarter only.
  • The GOV per day, per store comes around Rs 981,000 for this quarter.

SWOT Analysis of Zomato

Strengths:

  1. Diverse revenue streams that enhance financial stability.
  2. Robust financial backing from investors, enabling expansion.
  3. Extensive user base, driving consistent engagement.

Weaknesses:

  1. High operating expenses impacting profitability.
  2. Intense competitive pressure from other food delivery services.
  3. Limited international market presence hindering global growth.

Opportunities:

  1. Expansion potential in Tier 2 and Tier 3 cities.
  2. Opportunities for partnerships with cloud kitchens to diversify offerings.
  3. Growing potential for subscription model services to boost customer loyalty.

Threats:

  1. Increasing competition in the food delivery industry.
  2. Challenges in consumer retention amidst evolving market dynamics.
  3. Regulatory risks that could affect operational strategies.
Persistent Systems Q2FY25
Persistent Systems Q2FY25 Earnings: Profit Rises by 23.45% YoY

Company Overview

Persistent Systems, incorporated in 1990, is a global software and technology services company specializing in product engineering and digital transformation. The company has demonstrated expertise in emerging technologies, focusing on IoT products, platform development, and strategic partnerships with leading product companies. With a strong presence across sectors like industrial machinery, healthcare, Smart City, and smart agriculture, Persistent delivers solutions that span the entire product lifecycle. In its recent quarter, the company reported $345 million in revenue, marking 18.4% year-on-year growth and 5.3% sequential growth, with key contributions from Healthcare and Life Sciences (up 71.2%) and BFSI (up 15.3%). Persistent continues to drive growth, leveraging advanced technologies like AI and maintaining 18 consecutive quarters of growth.

Industry Outlook

The outlook for the IT sector in FY25 looks promising, with macroeconomic headwinds expected to subside, leading to improved earnings visibility. After outperforming the Nifty in the previous year, the IT sector is likely to maintain its momentum, benefiting from a lower base and easing headwinds. For Persistent Systems (PSL), the company is well-positioned to seize growth opportunities in digital technologies, thanks to its strong product development capabilities and early recognition of digital trends. Management is optimistic about achieving industry-leading revenue growth in FY24, driven by broad-based demand across various sectors, robust deal bookings, new client additions, and incremental revenue from acquisitions. PSL’s leadership in outsourced product development, long-standing client relationships, and end-to-end service offerings position it to capitalize on emerging opportunities effectively. With a strong presence in North America, Europe, and other regions, Persistent is expected to benefit from global digital transformation trends. Its focus on capability-led acquisitions, particularly in Europe, may help it capture new opportunities in consolidating markets.
Persistent aims to maintain industry-leading growth while optimizing margins by 200–300 basis points. Its focus on scaling advanced services, such as AI, and leveraging its robust pipeline suggests a strong performance in FY25.

Business Segments

  • Healthcare and Life Sciences:
    • This segment has experienced significant growth, with a year-on-year increase of 71.2%.
    • The growth is driven by expanding digital transformation initiatives in healthcare, including IoT applications and data analytics.
  • Banking, Financial Services, and Insurance (BFSI):
    • The BFSI sector recorded a 15.3% year-on-year growth. Persistent’s focus on AI adoption and digital services in financial operations is enhancing customer experience and operational efficiency.
  • Technology and High-Tech:
    • Although growth in this segment has been relatively slower, management expects an uptick in the next few quarters as demand increases. Investments in innovative technologies and strategic partnerships are expected to drive future growth.

Key Subsidiaries and Their Information

Persistent Systems has multiple wholly owned subsidiaries, with presence in over 20 countries.

  • Persistent Systems Inc.:
    • This North American subsidiary plays a critical role in driving growth, especially in the healthcare and BFSI sectors. The company is focusing on enhancing its digital offerings and has been successful in securing large deals.
  • Persistent Systems UK:
    • Focused on the European market, this subsidiary has been pivotal in expanding Persistent’s presence in Europe. It emphasizes product engineering and digital transformation services, catering to various industries, including automotive and finance.
  • Acquisitions and Partnerships:
    • Persistent has made several acquisitions to bolster its technology stack. For instance, the acquisition of MetaLogix has strengthened its capabilities in data management and analytics. Partnerships with leading technology companies enhance its service offerings, particularly in AI and cloud services.
  • Focus on Emerging Technologies:
    • Persistent’s subsidiaries are investing in emerging technologies like IoT, AI, and blockchain to enhance their service offerings and provide innovative solutions to clients. The company employs a global delivery model that leverages talent from various regions, ensuring cost efficiency and high-quality service delivery. With macroeconomic challenges easing and increased demand for digital transformation services, subsidiaries of Persistent Systems are well-positioned for sustained growth. The management is optimistic about capturing a larger market share in the digital services landscape, particularly with their strong track record in OPD.

Q2 FY25 Highlights

  • Revenue growth: PSL reported $345.5 million in revenues, up 5.1% q-o-q in constant currency (CC) terms beating our estimates of $342 million. Revenue in USD terms was up 5.6% q-o-q/18.4% y-oy while revenue in rupee terms stood at Rs. 2,897 crores, up 5.8% q-o-q/20.1% y-o-y. Growth was led by Healthcare & Lifesciences and BFSI verticals. Persistent reiterated its aspiration to achieve $ 2 billion revenue target by FY27. Management would endeavor to maintain utilization at 83-85%.
  • EBIT margins: EBIT margins was flat q-o-q at 14% slightly beating our estimates of 13.9%. Margin headwinds comprising of wage hike (-210 bps), absence of policy rationalization present in Q1 (-130 bps), Incremental impact of fresh ESOP issuance in Q2(-60 bps) and lower earnout credit (-60 bps) was neutralized by margin tailwinds comprising of Utilization (+120 bps), Sub contractor cost reduction (+70 bps), lower resale business (+50 bps), Pricing and right shoring (+130 bps), favorable currency (+30 bps) and absence of H-1B visa cost (+60 bps).
  • Order bookings: In the latest performance metrics, Persistent Systems reported a Total Contract Value (TCV) of $529 million, reflecting a 14% increase quarter-over-quarter (q-o-q) and a 10% increase year-over-year (y-o-y). The company achieved a book-to-bill ratio of 1.5x, up from 1.4x in Q1 FY25. New Business TCVs were particularly strong, reaching $389.8 million, which marks a 25% increase q-o-q and a 24% increase y-o-y. The Annual Contract Value (ACV) totaled $348.3 million, showing a modest 3% increase q-o-q and a more robust 10% increase y-o-y. Additionally, New Business ACV reached $218.6 million, reflecting a 10% increase q-o-q and a 19% increase y-o-y. These figures indicate a healthy growth trajectory for Persistent Systems, driven by strong demand and successful business strategies
  • Top clients & Client additions: Revenue from the top-5 clients, top-10 clients, top-20 clients, and top-50 clients grew 7.7%/ 5.3%/5.7%, and 5.4% q-o-q, respectively. Persistent added two clients in the $10mn+ and four clients in the $1mn+ revenue category sequentially.
  • Headcount & attrition: Net headcount additions declined by 282, taking total headcount to 23,130. TTM attrition inched up by 10 bps q-o-q to 12%. However, utilization improved 270 bps q-o-q to 84.8%.
  • Cash generation & DSO:  Cash & investments stood at Rs 1791.6 crore, down 6.2%       q-o-q. DSO stood at 68 from 67 in Q1FY25. Operating cash flows to PAT for Q2FY25 was 108.3% compared to 49.3% Q1FY25.

SWOT Analysis of Persistent Systems: Key Insights for Strategic Growth

Strengths:

  1. Expertise in Digital Transformation – Persistent Systems excels in cutting-edge digital transformation services, providing a strong competitive edge.
  2. Consistent Growth – The company has demonstrated steady revenue growth, reinforcing its position in the global market.
  3. Robust Deal Wins – Regular success in securing high-value contracts underscores its reliability and industry relevance.
  4. Global Presence – A well-established presence across North America, Europe, and other key regions, giving it a broad market reach.

Weaknesses:

  1. Dependence on BFSI and Healthcare – Heavy reliance on these sectors may limit diversification, posing a potential risk in times of industry slowdown.
  2. Smaller Size – Compared to some industry giants, Persistent Systems operates at a smaller scale, which may impact market dominance.
  3. Flat Margins – Margins have remained relatively stagnant, highlighting the need for cost optimization and efficiency improvements.
  4. Integration Challenges from Acquisitions – Ongoing acquisitions pose potential hurdles in seamless integration, impacting short-term operational efficiency.

Opportunities:

  1. Rising Demand for AI and Digital Transformation – The increasing adoption of AI and digital services presents lucrative growth opportunities.
  2. Healthcare and BFSI Expansion – Expanding its footprint in the rapidly growing healthcare and BFSI sectors can drive significant revenue.
  3. Focus on Cloud and IoT Solutions – With businesses globally shifting to cloud and IoT platforms, Persistent is well-positioned to capitalize on this trend.
  4. European Expansion – The company’s increasing focus on Europe offers new market opportunities, especially in digital transformation and engineering services.

Threats:

  1. Global Economic Uncertainty – Economic fluctuations could negatively impact client spending and growth projections.
  2. Competition from Industry Leaders – Larger competitors with greater resources and market share could pose a threat to Persistent’s expansion efforts.
  3. Currency Fluctuations – Persistent’s global operations expose it to currency exchange risks that could affect profitability.
  4. Cybersecurity Threats – As digital services grow, so do cybersecurity risks, requiring constant vigilance and investment to safeguard client data.

L&T Finance Holdings Q2 FY25
L&T Finance Q2 FY25 Results: Net Profit Rises 2% to ₹696 Crore, Revenue Jumps 17%

Company Overview

L&T Finance Holdings, part of the Larsen & Toubro Group, is a key player in India’s financial sector, offering a wide range of services across rural, housing, and infrastructure finance. Through its subsidiaries, it provides products like microfinance, two-wheeler loans, farm equipment finance, and home loans. The company is also involved in financing large-scale infrastructure projects.

L &T Finance emphasizes digital transformation, using data analytics and AI to enhance customer experience and streamline operations. It has adopted a strong Environmental, Social, and Governance (ESG) framework, ensuring sustainable business practices. In recent years, it has improved asset quality by reducing non-performing assets (NPAs) and focusing on cost optimization. With a focus on retail and rural finance, L&T Finance is committed to long-term, responsible growth in India’s financial ecosystem.

Industry Outlook

India’s economy is projected to grow by 7% in FY25, driven by strong private consumption and credit demand. This growth is set to significantly boost the financial sector, particularly non-bank financial companies (NBFCs), which are expected to see increased profitability despite higher funding costs. Credit demand is likely to expand, especially in infrastructure, housing, and microfinance sectors, with NBFC loan growth projected to increase by 15%, fueled by strong performance in key consumption areas. Infrastructure lending is poised for substantial growth due to large investments in energy and urban development. L&T Finance plans to expand its infrastructure portfolio by over 20% to capitalize on these opportunities. Additionally, the company is focused on improving asset quality, aiming to reduce its Gross Non-Performing Assets (NPAs) to below 3.0%, down from 3.1% in FY24.  L&T Finance is also expected to enhance its sustainability efforts by increasing   its allocation towards ESG projects.

Business Segments

  • Rural Finance: This includes microfinance, farm equipment finance, and two-wheeler loans, primarily catering to rural consumers. It plays a key role in driving financial inclusion in India’s rural economy.
  • Retail Finance: L&T Finance offers home loans, loans against property, and other personal loans, targeting individual consumers in urban and semi-urban areas.
  • Infrastructure Finance: The company has a significant presence in financing large-scale infrastructure projects, such as energy, transportation, and urban development, supporting India’s infrastructure growth.
  • Mutual Funds and Wealth Management:  Through L&T Investment Management, the company manages a wide range of mutual funds and wealth management products for retail and institutional investors.

Q2 FY25 Highlights

  • L&T Finance reported a Profit After Tax (PAT) of ₹696 crore, reflecting a 17% increase compared to the previous year. This growth is a strong indicator of the company’s profitability and overall financial health.
  • The company maintained a stable Return on Assets (RoA) at 2.60%, up 18 basis points year-over-year. With 96% of its loan book now in retail financing, it is advancing its “retailization” strategy to reduce corporate loan dependence and improve asset quality.
  • L&T Finance’s retail loan portfolio grew 28% YoY to ₹88,975 crore, driven by strong demand for home loans, vehicle financing, and microfinance. The consolidated book grew 18% YoY, the highest since Q1FY20.
  • L&T Finance improved its Net Interest Margin (NIM) to 8.94%, up by 32 bps YoY, while reducing its Weighted Average Cost of Borrowings (WACB) to 7.80%, down by 5 bps. Credit cost remained stable at 2.59%, and the collection efficiency for the rural segment stood at 99.45%.

Financial Summary

INR in Cr.FY25 Q2FY25 Q1QoQ (%)FY24 Q2YoY (%)
Total Operating Income401937846.20%321425.10%
Total Expenditure (Excl Depreciation)157514826.20%133118.30%
Operating Profit (PBDIT) excl Other Income244423026.20%188229.90%
Other Income502.00%268-98.30%
Operating Profit (PBDIT)244923026.40%215113.90%
Interest147613519.20%132511.40%
Depreciation332817.10%2817.50%
Profit Before Tax9409221.90%79717.80%
Tax2432372.50%20319.60%
Net Profit6976851.70%59417.20%
Share in Profit of Associates000.00%00.00%
Minority Interest1-0.43-523.10%1-223.60%
Consolidated Net Profit6966861.50%59516.90%

SWOT Analysis

Strengths:

  1. Strong Family Background
  2. Wide Range of Products
  3. Effective Retaliation Strategy
  4. Significant Presence in Rural Areas

Opportunities:

  1. Expanding Rural Market
  2. Government Investment in Infrastructure
  3. Growth in Digital Services
  4. Potential for Cross-Selling

Weaknesses:

  1. Heavy Reliance on External Borrowing
  2. Legacy Issues with Corporate Loans
  3. Non-Performing Assets (NPAs)
  4. Delay in Digital Transformation

Threats:

  1. Changes in Regulations
  2. Economic Slowdown
  3. Increasing Competition
  4. Fluctuations in Interest Rates

Hyundai Motor India Limited IPO
Hyundai Motor India Limited IPO 2024: Detailed & Subscribe or Avoid?

Prepared On: October 15, 2024

Hyundai Motor India Limited (HMIL) is set to launch its Initial Public Offering (IPO) with a total issue size of ₹27,870.16 crores. This significant offering comprises an offer for sale of 14.22 crore shares, marking one of the most anticipated IPOs in the Indian primary market.

IPO Subscription Period

  • Open Date: October 15, 2024
  • Close Date: October 17, 2024
  • Allotment Date: October 18, 2024
  • Listing Date: October 22, 2024 (Tentative)
  • Stock Exchanges: BSE and NSE

Pricing and Lot Details

  • Price Band: ₹1,865 – ₹1,960 per share
  • Face Value: ₹10 per share
  • Minimum Lot Size: 7 shares
  • Investment Requirements:
    • Retail Investors: Minimum ₹13,720 (7 shares)
    • Small Non-Institutional Investors (sNII): 15 lots (105 shares) – ₹205,800
    • Big Non-Institutional Investors (bNII): 73 lots (511 shares) – ₹1,001,560

Reservation Structure

The Hyundai Motor IPO reserves shares across various investor categories to ensure broad participation:

  • Qualified Institutional Buyers (QIB): 20% (2,82,83,260 shares)
  • Non-Institutional Investors (NII): 15% (2,12,12,445 shares)
    • Big NII (bNII): 10%
    • Small NII (sNII): 5%
  • Retail Investors: 35% (4,94,95,705 shares)
  • Employees: 0.55% (7,78,400 shares) at a discounted price of ₹186 per share
  • Anchor Investors: 30% (4,24,24,890 shares) raising ₹8,315.28 crores

Key Dates and Timeline

  • IPO Opens: Tuesday, October 15, 2024
  • IPO Closes: Thursday, October 17, 2024
  • Allotment Basis: Friday, October 18, 2024
  • Refund Initiation: Monday, October 21, 2024
  • Shares Credited to Demat: Monday, October 21, 2024
  • Listing Date: Tuesday, October 22, 2024
  • UPI Mandate Cut-off: 5 PM on October 17, 2024

Book Running Lead Managers

Hyundai Motor India Limited has appointed prominent financial institutions as book-running lead managers for the IPO:

  • Kotak Mahindra Capital Company Limited
  • Citigroup Global Markets India Private Limited
  • HSBC Securities & Capital Markets Pvt Ltd
  • J.P. Morgan India Private Limited
  • Morgan Stanley India Company Pvt Ltd

Kfin Technologies Limited has been designated as the registrar for the IPO.

Promoter Information

  • Promoter: Hyundai Motor Company
  • Shareholding:
    • Pre-Issue: 100%
    • Post-Issue: 82.50%

About Hyundai Motor India Limited

Established in May 1996, Hyundai Motor India Limited is a subsidiary of the Hyundai Motor Group, the world’s third-largest automotive OEM by passenger vehicle sales. HMIL manufactures and markets a wide range of vehicles, including sedans, hatchbacks, SUVs, and electric vehicles (EVs), supported by a robust network of 1,366 sales points and 1,550 service centers across India.

Key Models:

  • Grand i10 NIOS
  • i20 & i20 N Line
  • AURA
  • Elantra
  • Venue & Venue N Line
  • Verna
  • Creta & Creta N Line
  • Alcazar
  • Tucson
  • Ioniq 5 (All-Electric SUV)

HMIL’s manufacturing facility near Chennai is pivotal in producing its comprehensive vehicle lineup, catering to both domestic and international markets, including Africa, the Middle East, Bangladesh, Nepal, Bhutan, and Sri Lanka.

Financial Highlights

  • Revenue Growth: Increased by 16% from ₹61,436.64 crores (FY 2023) to ₹71,302.33 crores (FY 2024)
  • Profit After Tax (PAT): Rose by 29%, reaching ₹6,060.04 crores in FY 2024
  • Net Worth: ₹12,148.71 crores
  • Total Borrowing: ₹758.14 crores

Key Performance Indicators (KPIs):

  • ROCE: 13.69%
  • RoNW: 12.26%
  • P/BV: 14.93
  • EPS (Pre-IPO): ₹74.58
  • EPS (Post-IPO): ₹73.33
  • P/E Ratio (Pre-IPO): 26.28x
  • P/E Ratio (Post-IPO): 26.73x

IPO Objectives

Hyundai Motor India Limited will not receive any proceeds from the IPO. Instead, the promoter-selling shareholders will receive the Offer Proceeds after deducting offer-related expenses and applicable taxes.

Subscription Status (As of October 15, 2024, 7:02:07 PM)

  • Overall Subscription: 0.18x
  • Retail: 0.27x
  • QIB: 0.05x
  • NII: 0.13x
  • Employee Category: 0.81x

Total Applications Received: 9,89,91,410 for 1,80,50,557 shares bid.

Recommendation: Apply. The Hyundai Motor India Limited (HMIL) IPO offers strong growth potential due to its market leadership, solid financials, and strategic expansion into electric vehicles (EVs). Backed by the globally renowned Hyundai Motor Group, and with a robust outlook for future growth, this IPO presents an attractive opportunity for long-term investors, especially those looking for exposure to the automotive and EV sectors. Despite the slightly high P/E ratio, the company’s consistent performance and future plans make it a promising investment.

Today’s Top Stock Gainers and Losers

Top Gainers

SymbolLTP%ChngVolume
BPCL347.652.021,37,27,177
ICICIBANK1254.51.8585,88,260
BRITANNIA6063.31.433,59,368
BHARTIARTL17161.245,52,882
BEL288.751.071,27,67,396

Top Losers

SymbolLTP%ChngVolume
HDFCLIFE711.9-3.8854,99,755
BAJAJ-AUTO11520-3.193,75,715
BAJFINANCE7001.35-2.8811,97,442
WIPRO533.75-2.8892,10,172
HINDALCO726.75-2.1925,55,598

Just Dial reports
Just Dial Reports Q2 FY25 Earnings: 114% Surge in Net Profit and 9% Revenue Growth

Prepared On: October 12, 2024

Company Overview
Just Dial Ltd., founded on December 20, 1993, in Mumbai, India, is led by CEO Venkatachalam Sthanu Mani. As a key player in the Technology Services sector, particularly in Internet Software/Services, Just Dial is a leading local search engine in India. It offers comprehensive search services via website, mobile app, phone, and SMS, helping users find businesses, products, and services.

The latest JD App integrates features like Map-aided Search, Live TV, and Stock Quotes, making daily tasks easier. Just Dial also provides services such as bill payments and travel bookings, generating revenue through search services, transaction commissions, and certifications.

Key Company Information:

  • Company Name: Just Dial Ltd.
  • Founded: December 20, 1993
  • Headquarters: Mumbai, India
  • CEO: Venkatachalam Sthanu Mani
  • Sector: Technology Services
  • Industry: Internet Software/Services
  • ISIN: INE599M01018
  • Website: justdial.com

Industry Outlook:

The Internet Software and Services industry is growing rapidly due to increased internet use, digital transformation, and the shift to online platforms. Companies like Just Dial are well-positioned as more people rely on digital tools to find local businesses and services. The industry is being reshaped by emerging technologies like AI and automation, enhancing user experiences and operational efficiency. With a focus on mobile apps and personalized solutions, businesses are catering to the rising smartphone user base. As digital adoption spreads, especially in rural areas, localized search services are expected to thrive, driving further growth and innovation in the industry.

Business Segments:

  • Local Search Services: Users can discover businesses, products, and services via website, app, and SMS.
  • Transaction Services: Includes bill payments, travel bookings, and online transactions.
  • Rating Certifications: Business rating and certification services.
  • Website Creation & Digital Marketing: Offers website building and marketing solutions.
  • Revenue Streams: Search-related services, service certifications, and transaction commissions.

Earnings Report:

  • Q1 Results:
    • Net Profit: ₹141 crore
    • Revenue: ₹281 crore
    • Operating Expenses: ₹214 crore
    • Profit Before Tax (PBT): ₹154 crore
  • Q2 Results:
    • Net Profit: ₹154 crore (9% increase from Q1)
    • Revenue: ₹285 crore
    • Operating Expenses: ₹217 crore
    • Profit Before Tax (PBT): ₹182 crore
  • Summary: Strong financial performance with growth in net profit and revenue from Q1 to Q2.

Financial Summary

Just Dial’s financial performance has shown significant growth over the recent quarters. In Q1, the company achieved a net profit of ₹141 crore with revenue of ₹281 crore, accompanied by operating expenses of ₹214 crore and a Profit Before Tax (PBT) of ₹154 crore.

By Q2, Just Dial reported a net profit of ₹154 crore, marking a 9% increase from the previous quarter. Revenue rose to ₹285 crore, with operating expenses slightly higher at ₹217 crore. The PBT for Q2 reached ₹182 crore, reflecting the company’s robust financial health and effective cost management strategies.

Performance Overview:

Just Dial Ltd. delivered a strong performance in Q2 FY25, with significant growth across key financial metrics. The company’s net profit surged by 114% year-over-year, reaching ₹154 crore, driven by efficient cost management and rising revenue. Revenue from operations grew by 9%, totaling ₹285 crore, reflecting sustained demand for its digital solutions. The company also reported a 25% increase in total income and a 98% rise in profit before tax, signaling robust profitability. With strategic investments in technology and a growing user base, Just Dial continues to strengthen its position in the market.

Debt and Coverage:

Just Dial Ltd. maintains a healthy financial position with manageable debt levels.

  • Debt: ₹2.80B (2023), up from ₹700M (2020) 
  • Free Cash Flow: ₹64B 
  • Cash Reserves: ₹48B 
  • Strong debt coverage ensures financial stability and growth.

Stock Performance:
Just Dial’s stock has shown impressive growth, with a 2.96% increase on the BSE to ₹1,307.10 after its Q2 FY25 report and a 7% surge on the NSE to ₹1,359. Over the past year, the stock delivered a 76.10% return, with a 5-year growth of 110.43%. Its market cap stands at ₹100.10 billion, reflecting investor confidence.

SWOT Analysis:
Strengths: Strong brand, profit growth, AI investments.
Weaknesses: Limited global presence, rising debt.
Opportunities: B2B expansion, AI integration.
Threats: Intense competition, market dependency.

Conclusion:

In conclusion, Just Dial Ltd.’s Q2 FY25 performance highlights its strong market position and effective cost management, evidenced by significant profit and revenue growth. With strategic investments in technology and a focus on B2B expansion, Just Dial is well-positioned for continued success and value creation for stakeholders.

GM Breweries Q2 Earnings Report
GM Breweries Q2 Report: Stock Falls 3% Following Year-on-Year Sales Decline and Shrinking Profit Margins

Prepared On: October 10, 2024

Company Overview:
G M Breweries Ltd. is a significant player in the consumer non-durables sector, specializing in the production and sale of alcoholic beverages. Founded on December 9, 1981, by CEO Jimmy William Almeida, the company is based in Mumbai, India. G M Breweries focuses on manufacturing country liquor (CL) and Indian Made Foreign Liquor (IMFL) under brand names like G.M. Santra, G.M. Doctor, G.M. Limbu Punch, and G.M. Dilbahar Sounf. With a strong presence in Maharashtra, the company has established itself as the largest manufacturer of country liquor in the state.

Key Company Information:

  • Market Capitalization: ₹19.64 Billion
  • Dividend Yield (Indicated): 0.65%
  • P/E Ratio (TTM): 12.55
  • Net Income (FY): ₹1.52 Billion
  • Revenue (FY): ₹6.15 Billion
  • Employees: 363
  • ISIN: INE075D01018
  • Website: gmbreweries.com

Industry Outlook:
The alcoholic beverages industry in India is experiencing steady growth driven by factors like rising disposable incomes, changing consumer preferences, and urbanization. Market segments include beer, spirits (CL and IMFL), and wine, with spirits holding a significant market share.

Key Industry Trends:

  1. Regulatory Environment: Stringent regulations on licensing, taxation, and advertising impact industry profitability.
  2. Consumer Preferences: Shift towards premium and branded products, with a focus on quality and brand reputation.
  3. Distribution Channels: Expansion of organized retail and e-commerce enhancing consumer accessibility.
  4. Health and Wellness: Rising health awareness driving demand for healthier beverage options.
  5. Market Growth: Indian alcoholic beverages market is expected to grow at a CAGR of around 10% in the next five years.

Business Segments
G M Breweries operates in key segments focusing on country liquor, IMFL, and exploring opportunities in non-alcoholic beverages to diversify its product portfolio.

  • Country Liquor (CL): Leading presence in Maharashtra with brands like G.M. Santra and G.M. Doctor.
  • Indian Made Foreign Liquor (IMFL): Catering to middle to high-income consumers with a variety of spirits.
  • Other Segments: Focus on non-alcoholic beverages for product diversification.

Earnings Report
Q1 FY25:

  • Revenue from Operations: ₹152.3 crore
  • Net Profit: ₹31.5 crore
  • Profit Before Tax (PBT): ₹29.8 crore

Q2 FY25:

  • Revenue from Operations: ₹149 crore
  • Net Profit: Decreased by 13.11% quarter-on-quarter
  • Profit Before Tax (PBT): ₹28.97 crore

Half-Year Performance:

  • Net Profit: Increased by 10.24% to ₹46.61 crore in H1 FY25.

Financial Summary

  • Revenue (FY 2023): ₹6.15 Billion
  • Net Income (FY 2023): ₹1.52 Billion
  • Market Capitalization: ₹19.64 Billion
  • Dividend Yield (Indicated): 0.65%
  • P/E Ratio (TTM): 12.55

Performance Overview:

  • Revenue Trend: Stable with minor fluctuations, half-year revenue up by 1% year-on-year.
  • Profitability: Net profit improved in H1 FY25 despite a decrease in Q2 FY25.
  • Expense Management: Total expenses slightly increased, and raw material costs declined.
  • Cash Flow: Operating cash flow has declined over the past three years.

Debt and Coverage:

  • Debt managed effectively with a steady increase.
  • Careful monitoring of free cash flow and coverage ratios is needed for financial stability.

Stock Performance Insights:

  • Appreciation of 41.98% YTD, absolute 1-year return of 39.67%.
  • Shareholding pattern indicating ownership distribution among promoters, institutional investors, and public shareholders.

SWOT Analysis:

  • Strengths: Market leadership, diverse product portfolio, robust financials, consistent dividend growth.
  • Weaknesses: Decline in PAT, cash flow issues, market dependence.
  • Opportunities: Market expansion, product diversification, digital growth, partnerships.
  • Threats: Regulatory risks, competition, economic factors, health trends.

Conclusion:
G M Breweries Ltd. showcases strength and market positioning in Maharashtra’s alcoholic beverages industry. Despite challenges in Q2 FY25, the company reported stable revenue and improved profits in H1 FY25—an attractive investment option with strengths and areas of concern for investor consideration.

Garuda Construction and Engineering IPO: Everything You Need to Know

Garuda Construction and Engineering Limited is opening its doors to public investment with an IPO worth ₹264.10 crores. This offering consists of a fresh issue of 1.83 crore shares aggregating ₹173.85 crores and an offer for sale of 0.95 crore shares worth ₹90.25 crores. Mark your calendars—this IPO is open for subscription from October 8, 2024, to October 10, 2024, with the tentative listing date on BSE and NSE set for October 15, 2024.

Key Dates to Remember:

  • IPO Open Date: October 8, 2024
  • IPO Close Date: October 10, 2024
  • Allotment Finalization: October 11, 2024
  • Listing Date: October 15, 2024

Price Band and Lot Size: The IPO price is set at ₹92-₹95 per share, with a minimum lot size of 157 shares. Retail investors can start with an investment of ₹14,915. For high-net-worth investors (HNIs), the minimum investment goes up to ₹208,810 for 14 lots.

Company Overview: Founded in 2010, Garuda Construction and Engineering Limited specializes in residential, commercial, industrial, and infrastructure projects. Their portfolio spans across residential/commercial buildings, infrastructure, and hospitality projects. The company’s focus on mechanical, electrical, and plumbing (MEP) services, as well as its expertise in project management, highlights its strong market positioning.

With a growing order book of ₹1,40,827.44 crore as of September 2024, Garuda is setting the stage for continued growth. Their projects spread across regions like MMR, Karnataka, and Rajasthan, showcasing their nationwide presence.

Financial Overview: Garuda has seen fluctuations in its financial performance, with revenue from operations recorded at ₹1,187.50 crores for the period ending April 30, 2024. Despite a slight decline in profit after tax from ₹40.8 crores in FY23 to ₹36.44 crores in FY24, the company’s robust order book and strong execution capabilities suggest long-term potential.

Key Performance Indicators (FY24):

  • ROE: 36.14%
  • ROCE: 46.69%
  • PAT Margin: 23.63%
  • Market Cap: ₹883.9 crores

IPO Objectives: The funds raised will primarily support:

  1. Working capital requirements
  2. General corporate expenses
  3. Potential inorganic acquisitions

Subscription Status: As of October 8, 2024 (Day 1), the IPO had been subscribed 0.68 times. The retail portion saw strong interest with a subscription of 1.25 times, while the QIB category is yet to attract bids.

Should You Invest? While Garuda boasts a strong portfolio and a promising pipeline of projects, some concerns linger regarding its financial volatility. Their previous IPO attempt by a group company, PKH Ventures, was withdrawn due to a tepid market response. Dilip Davda, a market expert, advises caution with this IPO, categorizing it as a “High Risk/Low Return” opportunity due to aggressive pricing.

Final Thoughts: Garuda Construction and Engineering presents an exciting opportunity for investors seeking exposure to the construction sector. With a well-established presence in the market and a robust order pipeline, the company is set for growth. However, the cautious financial outlook and pricing concerns should be weighed carefully before investing.

Garuda Construction and Engineering IPO Review (Avoid)
Dilip Davda recommends avoiding this IPO due to the company’s inconsistent financial performance and high trade receivables compared to revenue. A related group company, PKH Ventures, withdrew its IPO in 2023 due to poor market response. Despite holding over ₹1,400 crore in orders, the issue is aggressively priced based on FY25 earnings, making it a high-risk, low-return investment.

Ashok Leyland: Gears Up to Launch Hydrogen-Powered Truck in 2 Years

Date: October 7, 2024

Executive Summary

Ashok Leyland Ltd. (NSE: ASHOKLEYNSE) is a leading player in India’s commercial vehicle and defense sectors. As of the latest market close, its stock is priced at ₹222.42, reflecting a decrease of ₹2.97 (-1.32%). With a market capitalization of ₹661.72 billion and a P/E ratio of 27.05, the company faces an evolving market environment. Ashok Leyland’s innovation focus and advancements in alternative fuel vehicles offer promising future prospects. This report provides a detailed analysis of the company’s financials, strategic growth plans, and the latest developments in green mobility.


Latest Developments

Hydrogen-Powered Truck Launch and Electric Truck Deliveries

Hydrogen-Powered Truck:
On October 2, 2024, Ashok Leyland announced its plans to commercially launch India’s first hydrogen-powered truck within the next 18-24 months. This follows the unveiling of India’s first hydrogen internal combustion engine (H2-ICE) powered heavy-duty truck, in collaboration with Reliance Industries, in February 2023. The company is positioning itself as a leader in green transportation, with hydrogen-powered vehicles representing a significant step towards sustainable energy solutions.

Electric Truck Deliveries:
On the same day, Ashok Leyland commenced delivery of 180 electric trucks to Billion Electric Mobility, marking the largest single order of electric trucks in India to date. The vehicles, including the BOSS Electric Truck and the AVTR 55T Electric Tractor, will be deployed on key routes, such as Chennai-Bengaluru and Chennai-Vijayawada. The company has also announced plans to expand production of electric trucks at its Hosur plant, focusing on alternative energy vehicles.

CEO Shenu Agarwal’s Statement:
“Ashok Leyland is committed to pushing the boundaries of innovation, leading the shift to green mobility. Our BOSS ICV Electric trucks and AVTR 55T Electric Tractors represent cutting-edge technology aimed at enhancing the customer experience and promoting sustainability,” Agarwal said.

These strategic initiatives reflect Ashok Leyland’s commitment to offering eco-friendly mobility solutions and revolutionizing India’s commercial vehicle industry through green technology.


Company Overview

Founded: September 7, 1948
Headquarters: Chennai, India
CEO: Shenu Agarwal
Employees: Approximately 31,770 (FY)
Website: ashokleyland.com

Ashok Leyland Ltd. is a dominant player in the manufacturing and sale of commercial and defense vehicles. With its recent advancements in hydrogen and electric vehicle technologies, the company is positioning itself for long-term growth in sustainable mobility.


Stock Performance

  • Current Price: ₹222.42
  • Day’s Change: -₹2.97 (-1.32%)
  • Market Capitalization: ₹661.72 billion
  • Dividend Yield: 0.00%
  • P/E Ratio (TTM): 27.05
  • Basic EPS (TTM): ₹8.34

The stock has experienced a slight decline in recent trading sessions. Investors should monitor the P/E ratio relative to industry peers to assess valuation attractiveness.


Fundamental Analysis

Key Metrics

  • Market Capitalization: ₹661.72 billion
  • Enterprise Value: ₹661.72 billion
  • Price-to-Sales (P/S) Ratio: 1.41x
  • Net Income: Data pending
  • Revenue: Data pending

Ownership Structure

  • Free Float Shares: 1.76 billion (59.89%)
  • Closely Held Shares: 1.18 billion (40.11%)

Ashok Leyland’s ownership structure shows a strong free float, enhancing liquidity for investors, though the significant portion of closely held shares could influence stock volatility based on insider activity.


Valuation

Ashok Leyland’s P/E ratio of 27.05x suggests that investors are paying ₹27.05 for every ₹1 of earnings, which is relatively high compared to industry standards. The P/S ratio of 1.41x aligns with a fair valuation relative to its revenue.

Historical Valuation Trends

  • 2019-2023 P/E Ratio: An upward trend in valuation reflects increased investor confidence and earnings growth.
  • P/S Ratio: Steady growth, indicative of expanding revenue.

Financial Health

Debt and Coverage

  • Debt Level (2023): ₹450 billion
  • Free Cash Flow: Data pending
  • Cash & Equivalents: Data pending

Ashok Leyland maintains significant debt, which will require close attention as the company expands into hydrogen and electric vehicle production. Managing cash flows and debt servicing capabilities will be key to ensuring long-term financial health.

Asset and Liability Structure

  • Total Assets (2023): ₹400 billion
  • Total Liabilities (2023): ₹450 billion

Liabilities exceeding assets raise potential solvency concerns, and investors should monitor the company’s strategies for reducing debt.


Growth Prospects

Green Mobility Initiatives

  • Hydrogen-Powered Trucks: The expected launch of the first hydrogen-powered truck in 18-24 months marks a significant development for the company and India’s shift towards sustainable transportation.
  • Electric Truck Production: With new electric vehicle models being delivered, and specialized assembly lines planned for the Hosur plant, Ashok Leyland is poised for growth in the electric commercial vehicle segment.

Revenue Streams

  • By Source:
    • Commercial Vehicles: Dominates revenue generation.
    • Financial Services: Offers additional revenue streams.
  • By Geography:
    • India: Primary market with strong growth potential.
    • International: Expanding presence globally.

Risks

  • Debt Levels: High liabilities could strain financial flexibility.
  • Market Competition: Intense competition in the commercial vehicle sector may impact market share.
  • Economic Slowdown: A decline in economic activity could reduce demand for commercial vehicles.
  • Regulatory Changes: New environmental and safety regulations could lead to increased compliance costs.

Adani Ports Faces Turbulence: Stock Plummets Amid Escalating Israel-Iran Conflict!

About ADANIPORTS:

Adani Ports & Special Economic Zone Ltd. (ADANIPORTS), founded in 1998 and headquartered in Ahmedabad, India, is a leading company in the transportation and logistics sector. It specializes in developing, operating, and maintaining port-related infrastructure through two key segments: Port and Special Economic Zone (SEZ) activities, and Others (which includes services like aircraft operations and container train services). ADANIPORTS is India’s largest private port operator, with a growing presence in international trade and infrastructure projects.

Market Outlook for ADANIPORTS:

Adani Ports & SEZ Ltd. has shown strong long-term growth, with a 63.28% increase over the past year and a 32.02% rise YTD. However, short-term volatility is evident, as the stock dropped 4.14% in one day, reflecting broader market trends or specific company developments. With upcoming earnings on October 29, 2024, market participants will closely monitor results to gauge the company’s recovery from recent dips. Long-term growth prospects remain solid, driven by infrastructure investments and international expansion.

Business Segments:

Adani Ports & Special Economic Zone Ltd. operates through two primary business segments:

  1. Port and SEZ Activities: This includes the development, operation, and maintenance of ports and port-related infrastructure. It is the core segment responsible for handling the majority of India’s cargo movement and facilitating international trade.
  2. Others: This segment consists of ancillary activities such as aircraft operations, utilities services, and container train services. Both segments contribute to the company’s strong infrastructure and logistics footprint in India and internationally.

Q1 FY25 Highlights:

For Q1 FY25, Adani Ports & Special Economic Zone Ltd (APSEZ) delivered strong financial performance. Here are the key highlights:

  1. Revenue Growth: Revenue grew by 11.34% year-on-year (YoY) to ₹6,956 crore. This growth was fueled by an 8% YoY increase in cargo volumes, reaching 109 million metric tons (MMT). Container volumes rose by 18%, and liquids and gas volumes increased by 11%.
  2. Net Profit: The company reported a net profit of ₹3,113 crore, marking a 47% increase YoY. This sharp rise was despite a temporary disruption at Gangavaram Port, which caused a 5.7 MMT cargo volume loss. However, operations there have now been restored.
  3. EBITDA: APSEZ recorded a quarterly EBITDA of ₹4,245 crore, a 13.1% YoY growth, with the EBITDA margin increasing to 61%. Domestic port EBITDA also saw a 32 basis point improvement.
  4. Outlook for FY25: The company expects to generate revenue between ₹29,000 crore to ₹31,000 crore, and EBITDA of ₹17,000 crore to ₹18,000 crore. Cargo volumes are expected to be between 460 MMT and 480 MMT. Additionally, capital expenditures for the year are projected to be around ₹10,500 crore to ₹11,500 crore.

Financial Summary:

Financial MetricAmount
Revenue (Q1 FY25)₹6,956 crore
Net Profit (Q1 FY25)₹3,113 crore
EBITDA (Q1 FY25)₹4,245 crore
Revenue Growth (YoY)11.34%
Net Profit Growth (YoY)47%
EBITDA Margin (Q1 FY25)61%
Cargo Volume (Q1 FY25)109 MMT
Estimated Revenue (FY25)₹29,000 – ₹31,000 crore
Estimated EBITDA (FY25)₹17,000 – ₹18,000 crore
Capital Expenditure (FY25)₹10,500 – ₹11,500 crore

Note: Adani Ports’ strong Q1 performance reflects its resilience and strategic initiatives in navigating operational challenges while capitalizing on growth opportunities. The company’s robust financial metrics position it well for future growth, making it a key player in the Indian logistics and transportation landscape.

Recent News:

Adani Ports shares slipped 5.4% to an intra-day low of ₹1,337 as Hamas fired rockets in southern Israel, making it the major loser in the Nifty 50 on October 7. The company operates Haifa Port, located in the south of Israel, and the Israeli military reported that rockets fired from northern Gaza entered southern Israel on October 6, a day before the first anniversary of Hamas’s October 7 attack.

A year ago, when the conflict between Hamas and Israel erupted, Adani Ports issued a statement saying, “We are closely monitoring the action on the ground which is concentrated in south Israel, whereas Haifa Port is situated in the north. We have taken measures to ensure the safety of our employees, and all of them are safe. We remain fully alert and prepared with a business continuity plan that will enable us to respond effectively to any eventuality.”

Adani Ports’ stock has again fallen after Hamas fired rockets over Israel on October 6, resulting in some humanitarian loss for Israel. The Adani Group fully acquired Haifa Port in February 2023, with Israel’s envoy to India emphasizing the symbolic trust placed in Indian companies by handing over a strategic asset.

Adani Ports vs. Nifty 50:

The stock of Adani Ports has fallen 6% in the past five trading sessions and 5.5% in the last month. However, it has provided a 30% return year-to-date, 72% over the past year, and 232% over the last five years. In comparison, the Nifty 50 index has fallen 5% in the past five days and erased 0.6% of investors’ wealth in the last month but has risen 14% year-to-date and provided a 27% return over the past year.