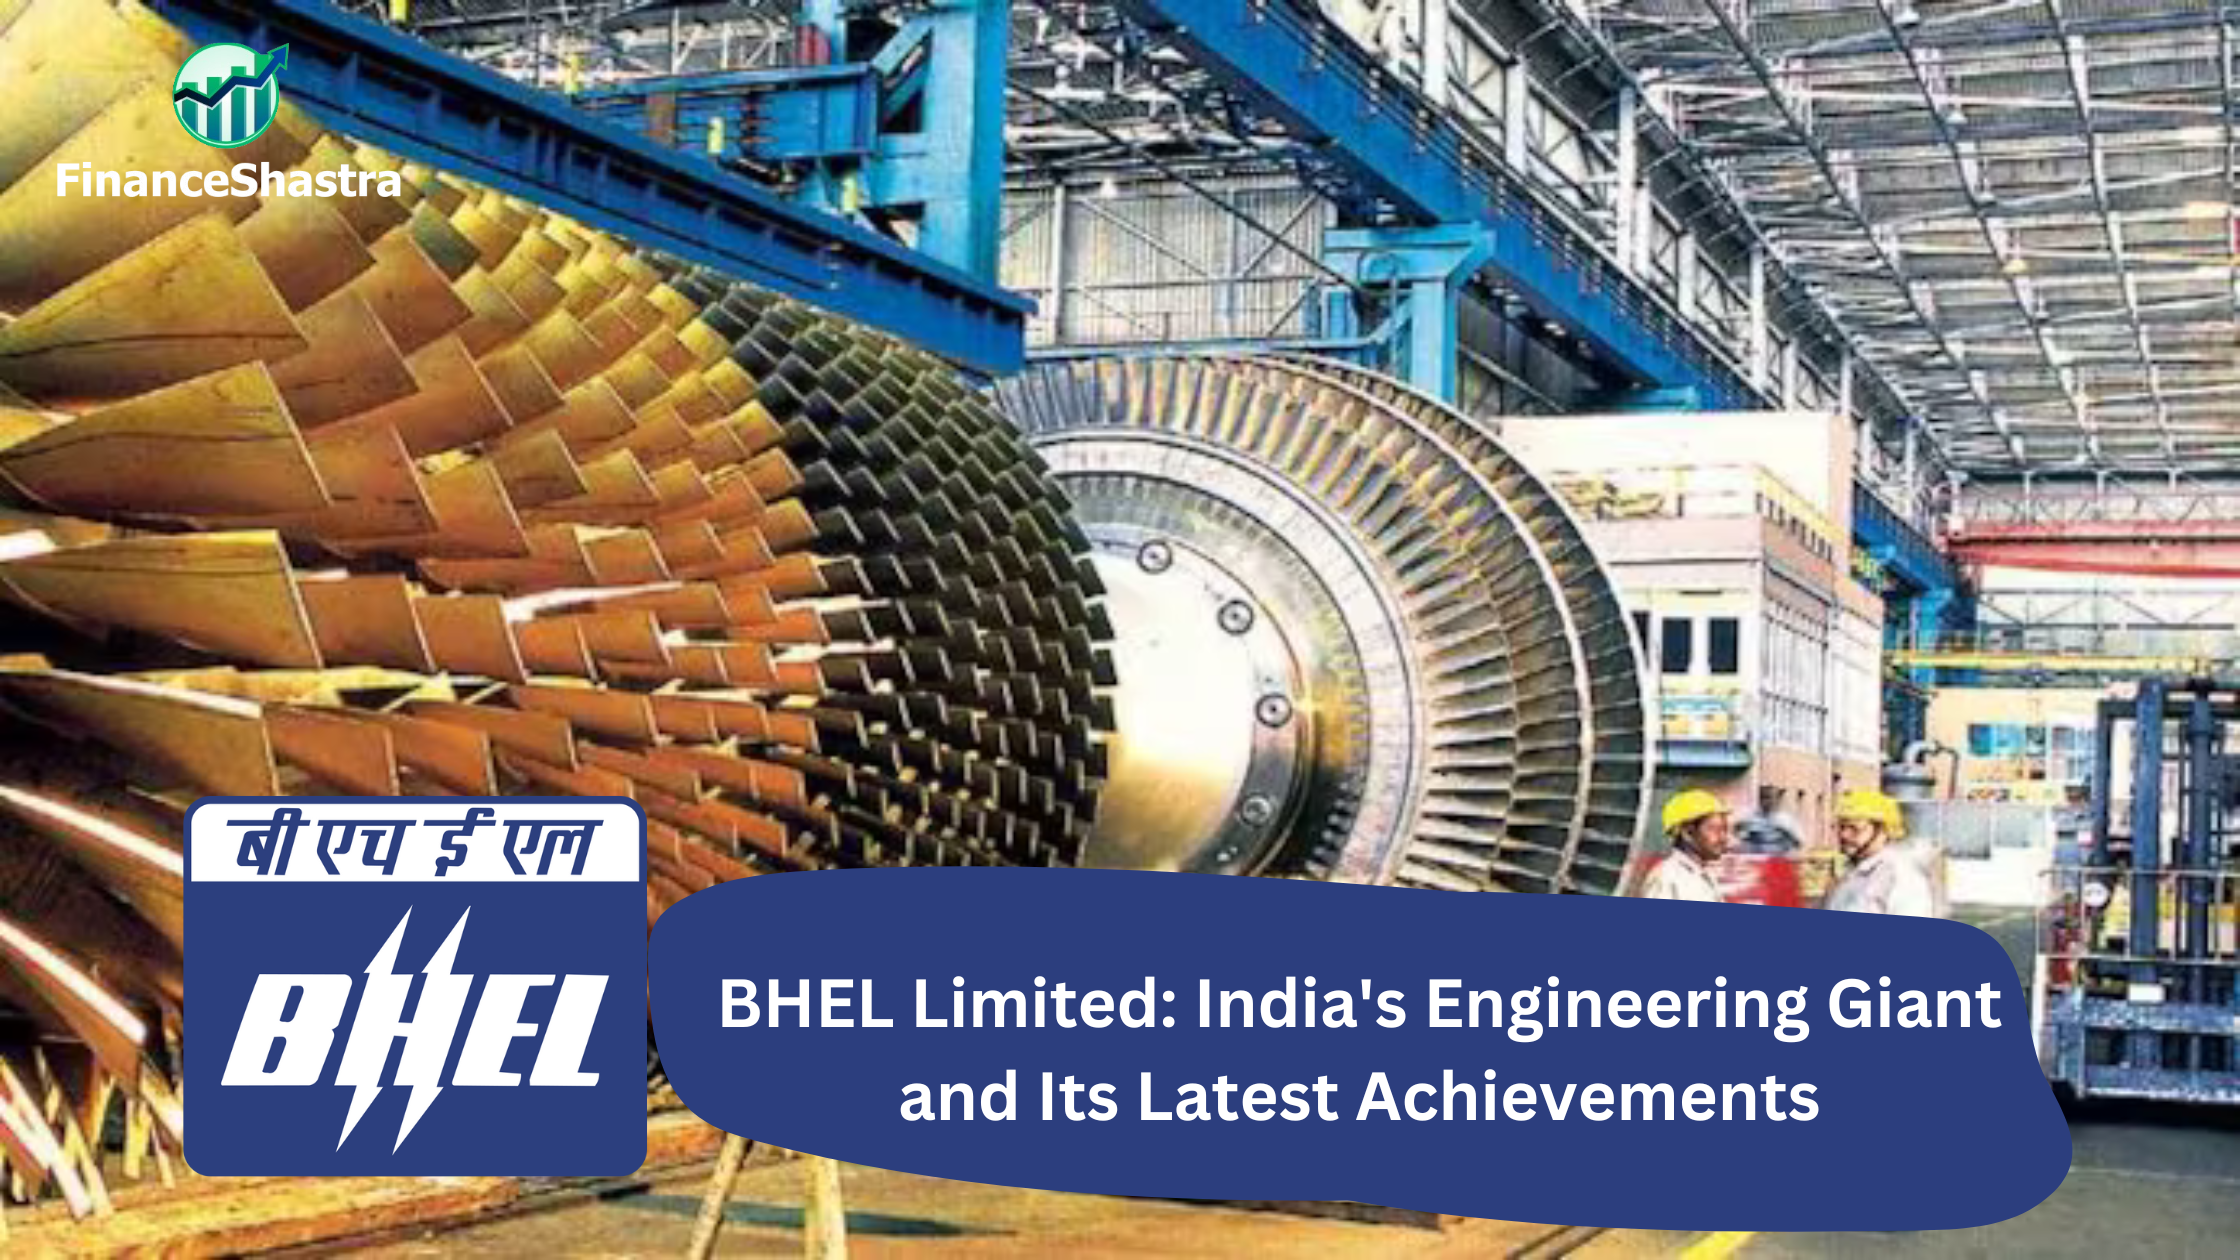
Bharat Heavy Electricals Limited (BHEL) is one of India’s largest engineering and manufacturing companies in the energy and infrastructure sectors. Established in 1964, BHEL is a central public sector enterprise under the Ministry of Heavy Industries. It plays a pivotal role in India’s industrial and economic development, contributing to power generation, transmission, transportation, and renewable energy. HEL specializes in designing, engineering, manufacturing, and servicing a wide range of products and systems for power plants, industrial equipment, and transportation. The company has a vast product portfolio, including boilers, turbines, generators, and transmission systems, alongside providing services such as project management and construction. BHEL has done projects in over 80 countries, shows the strong footprint of BHEL.
Latest Stock News (13 Jan 2025)
Bharat Heavy Electricals Limited (BHEL) has achieved yet another milestone in Bhutan with the successful commissioning of two units of the 6×170 MW Punatsangchhu-II Hydroelectric Project (PHEP-II). Executed as part of a bilateral agreement between the Government of India and the Royal Government of Bhutan, PHEP-II is a Greenfield hydro project located in the Wangdue district of Western Bhutan. Bharat Heavy Electricals Limited (BHEL) and Oil & Natural Gas Corporation Ltd. (ONGC) have signed a MoU for exploring joint projects and collaboration in the area of New and Renewable Energy business. This MoU will help in contributing towards the country’s National Green Hydrogen Mission, as well as leveraging the combined strengths of both organisations for collaborating in emerging areas within the clean energy ecosystem.
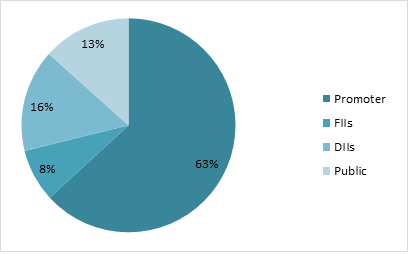
Shareholding Pattern as on September 2024
Key Stats
Market Capitalisation: ₹67604 Crore
P/E: 152
ROCE: 3.4%
ROE: 1.1%
Dividend Yield: 0.12%
Peer Comparison
Amt in ₹ Cr
MCap
Sales
PAT
ROCE
Asset Turn.
EV/EBITDA
D/E
P/E
BHEL Ltd
67604
25833
444
3.37%
0.41
45.4
0.38
152
Siemens
208588
22239
2716
25.6%
0.93
49.5
0.02
76.8
ABB Ltd
130267
11580
1688
30.7%
1.03
52.1
0.01
77.5
Hitachi Energy
53777
5850
199
17.8%
1.21
130.6
0.25
270
Premier Energies
59630
3143
231
25.2%
1.11
96.9
0.55
214.9
Financial Trends
Amount in ₹ Cr
2020
2021
2022
2023
2024
Revenue
21463
17309
21211
23365
23893
Expenses
21596
20357
20383
22321
23182
EBITDA
-133
-3049
828
1044
711
OPM
-1%
-18%
4%
4%
3%
Other Income
590
393
405
544
608
Net Profit
-1468
-2700
445
654
282
NPM
-6.84%
-16%
2%
3%
1%
EPS
-4.21
-7.75
1.28
1.88
0.81
Stock Price Analysis
In terms of performance, Bharat Heavy Electricals has shown a return of -5.53% in one day, -23.88% over the past month, and -28.39% in the last three months. Over the past 52 weeks, the shares have seen a low of ₹195.6 and a high of ₹335.4. The stock has been falling for past 6 months; it is because of the weak quarter. The volumes have also reduced and the stock might fall more as the overall market is negative.
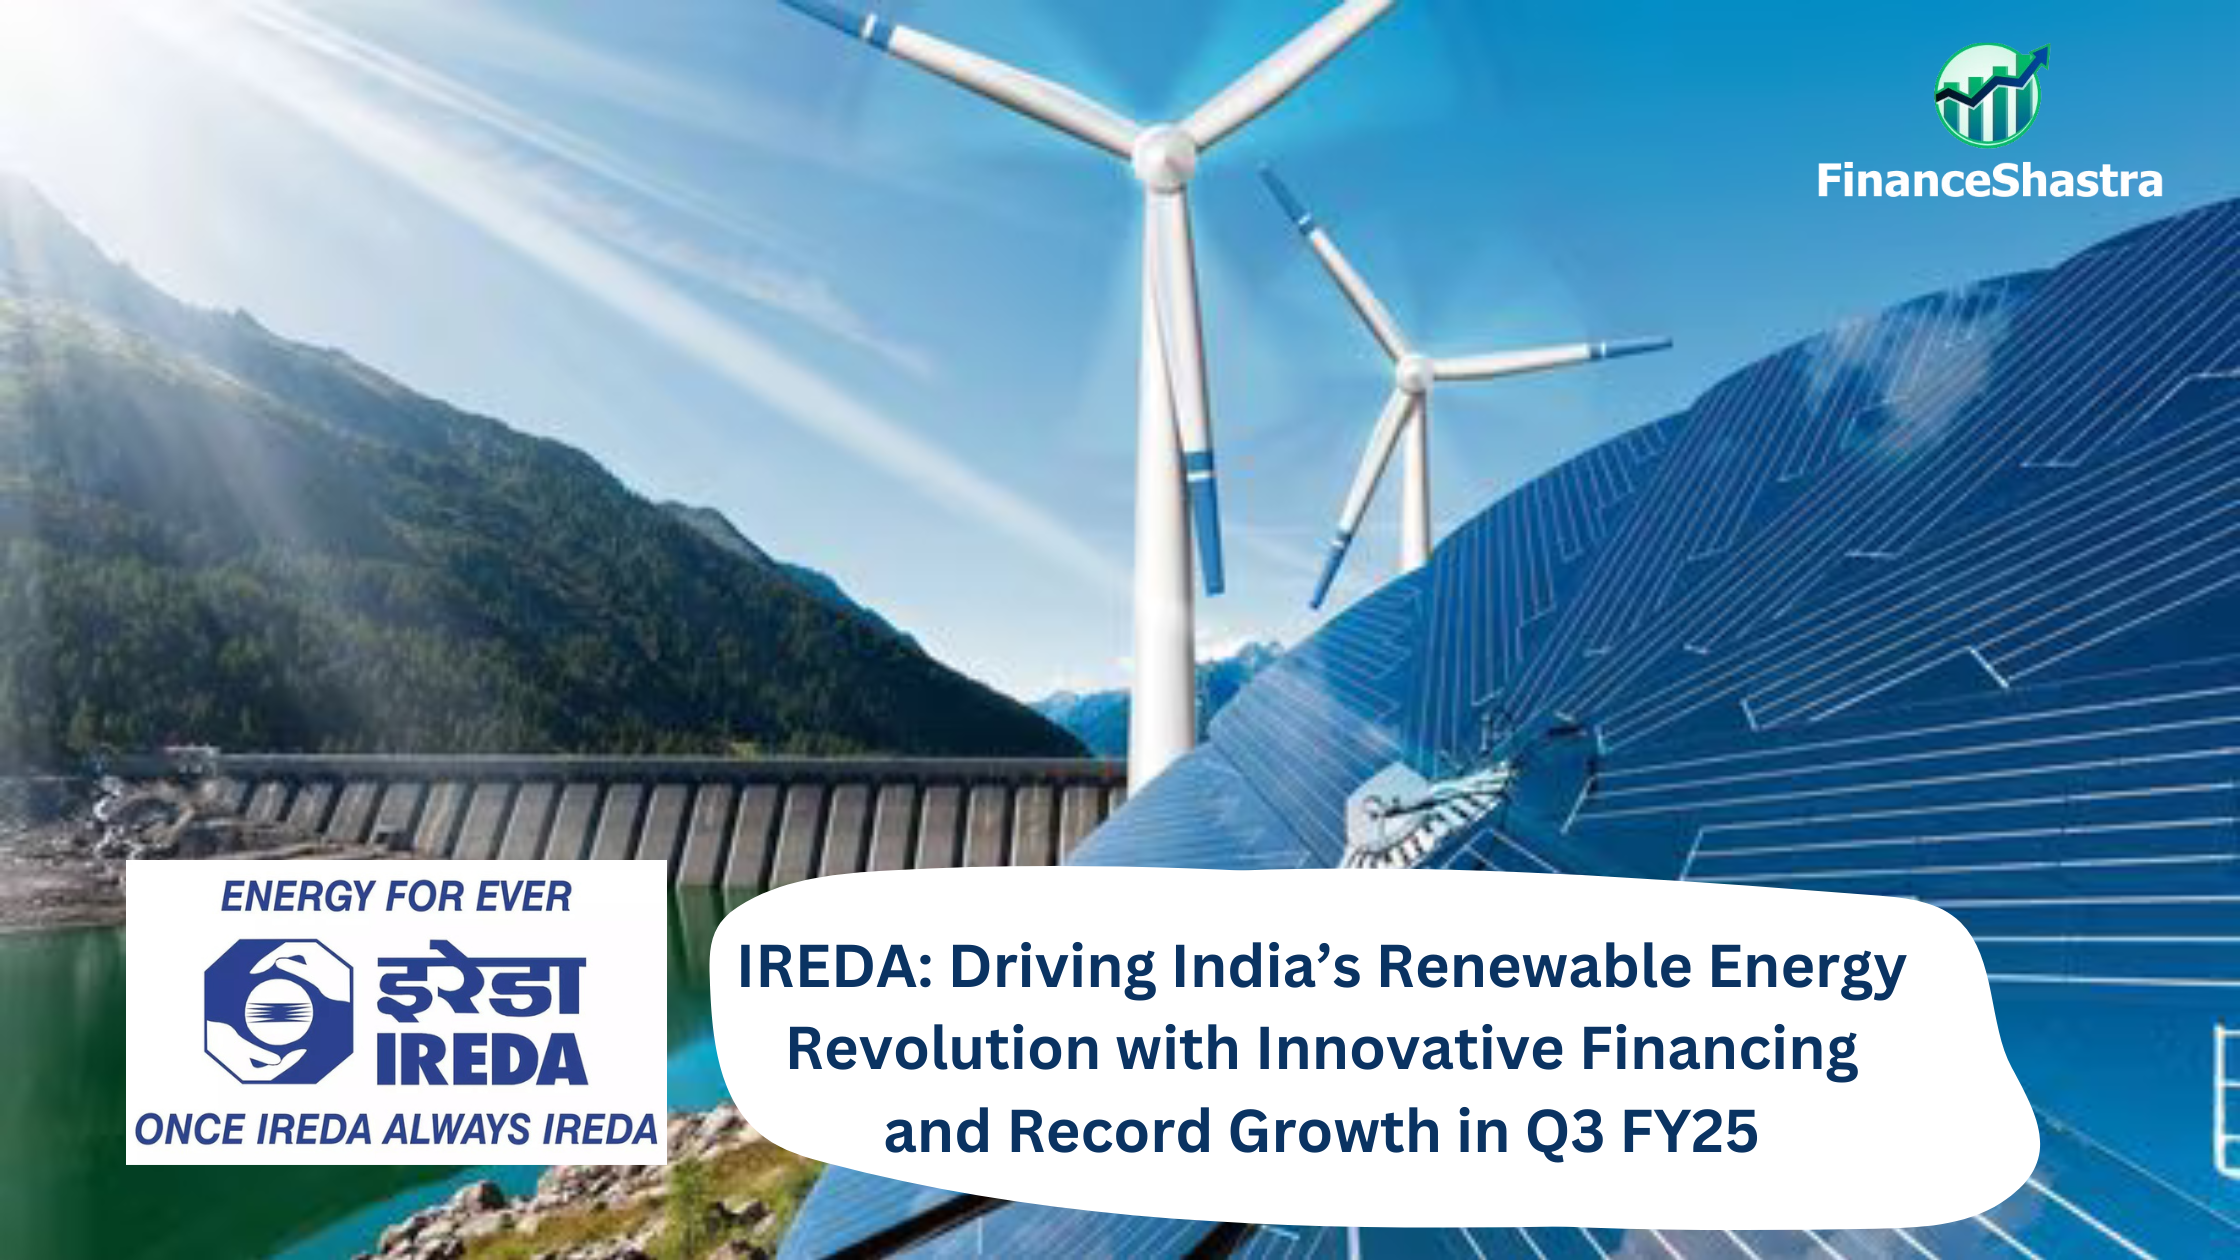
Incorporated in 1987, Indian Renewable Energy Development Agency Ltd. (IREDA) is a Government of India enterprise operating under the Ministry of New and Renewable Energy (MNRE). It is a public financial institution primarily focused on promoting, developing, and financing renewable energy and energy efficiency projects across India. As a specialized institution, IREDA plays a pivotal role in India’s transition towards a sustainable and low-carbon economy by supporting the government’s renewable energy initiatives. IREDA has been instrumental in financing a significant portion of India’s renewable energy capacity, supporting the country’s ambition of achieving 500 GW of non-fossil fuel capacity by 2030. India’s renewable energy sector is poised for exponential growth, driven by ambitious government targets, favourable policies, and technological advancements. With the push for green hydrogen, offshore wind projects, and large-scale solar parks, IREDA is positioned to play a critical role in financing and driving the nation’s green energy transformation. Its expertise and robust financial strategies make it a key player in India’s journey towards sustainable energy leadership.
Business Segments:
Renewable Energy Financing: It provides financing to large-scale solar photovoltaic (PV) power plants, rooftop solar projects, and solar thermal systems. Supporting initiatives to generate energy from agricultural waste, municipal solid waste, and other biomass resources. Major segments were Solar Energy, Wind Energy Projects, Biomass Projects, Hydro Power projects, etc.
Innovative Financing Solutions: It is a way of financing through issuing green bonds to raise funds for renewable energy projects, attracting both domestic and international investors, offering refinancing options for operational renewable energy projects to optimize capital structures or short-term funding solutions for projects awaiting long-term financing or subsidies from government schemes.
Subsidiary Information:
IREDA Global Green Energy Finance IFSC Ltd: It is a wholly owned subsidiary operates from GIFT city Gandhinagar, Gujarat. Its mission is to provide finance and promote renewable energy projects, domestically and internationally, aligning with IREDA’s vision of expanding sustainable energy solutions. This entity is designed to manage retail business under schemes like PM-Suryaghar (Rooftop Solar) and PM-KUSUM, as well as B2C segments in renewable energy and emerging sectors, including electric vehicles, energy storage, green technologies, sustainability, and energy efficiency.
Q3 FY25 & Business Highlights
Revenue of ₹1698 crore in Q3 FY25 up by 35% YoY from ₹1253 crore in Q3 FY24.
EBITDA of ₹548 crore in this quarter at a margin of 32% compared to 31% in Q3 FY24.
Profit of ₹425 crore in this quarter compared to a ₹336 crore profit in Q3 FY24.
IREDA signed MoU with SJVN and GMR for 900MW Hydropower Project in Nepal.
Incorporation of IREDA Global Green Energy Finance IFSC Limited, a wholly owned subsidiary in GIFT City Gandhinagar for Foreign currency financing.
The Renewable capacity of IREDA was 125GW in FY19 which has increased to 206GW in FY25, with highest share of solar power in capacity.
The gross yield on loan assets has come to 9.96% and the cost of borrowing at 7.68%, which creates interest spread of 2.28%.
The sector wise loan disbursement as on 31 December is majorly 26% solar, 15% wind, 12% hydro power18% loan facility to state utilities.
Godavari Biorefineries Limited (GBL) is a pioneer in bio-based products with a rich history dating back to its founding in 1940 as The Godavari Sugar Mills Limited. Originally incorporated as Godavari Investment and Finance Corporation Limited in 1956, the company was rebranded in 2006 to align with its shift to biorefinery operations. GBL operates a diversified business spanning sugar production, bio-based chemicals, ethanol, power generation, and other bio-products, leveraging sugarcane as its primary feedstock. GBL was among the first Indian companies to use sugarcane juice and syrup for ethanol production. Its product portfolio includes bio-based chemicals like ethyl acetate, bio-ethyl acetate, MPO, 1,3 butylene glycols, and crotonaldehyde, along with ethanol, sugar, and power. These chemicals serve diverse industries, including agrochemicals, cosmetics, pharmaceuticals, and food, while ethanol is supplied to oil marketing companies, beverage producers, and chemical industries. The company emphasizes sustainability, converting by-products like press mud into fertilizers under the ‘Bhumilabh’ brand and using bagasse for power generation.
Sakarwadi Facility (Maharashtra): Specializes in bio-based chemicals, using ethanol or rectified spirits.
Over its decades-long journey, GBL has achieved notable milestones. It began producing rectified spirits and acetic acid in 1962, alcohol manufacturing at Sameerwadi in 1985, and ethyl acetate at Sakarwadi in 1993. By 2016, the company had introduced innovative products like MPO and 1,3 butylene glycolss, expanding its chemical portfolio.
Godavari Biorefineries Limited (GBL) recently went public with an Initial Public Offering (IPO) worth ₹554.75 crores. The IPO was structured as a book-built issue, comprising a fresh issue of ₹325 crores (0.92 crore shares) and an offer for sale of ₹229.75 crores (0.65 crore shares). The funds are being utilized to strengthen its position in the bio-economy sector and finance its expansion plans, reflecting the company’s strategic focus on growth and sustainability. Positioned as a leader in renewable and bio-based products, GBL’s diversified operations ensure resilience across multiple industries, from energy and chemicals to food and pharmaceuticals.
Industry Outlook
The bio-based chemicals industry is witnessing rapid growth, driven by the increasing need for environmentally sustainable solutions. The global biochemical market, valued at USD 10.4 billion, is projected to grow at an impressive CAGR of 10.4%, indicating strong expansion potential. This growth is supported by several factors, including the shift towards natural products, rising demand for sustainable ESG sourcing, and a focus on better control of feedstock supply chains. Additionally, the ban on hazardous chemicals and favorable government policies promoting eco-friendly alternatives further strengthen the industry’s outlook.
For Godavari Biorefineries Limited (GBL), this sector growth presents a significant opportunity. With its established presence in bio-based chemicals, ethanol, and renewable energy, GBL is well-positioned to capitalize on this demand. The company’s focus on natural ingredients, including bio-ethyl acetate and 1,3 butylene glycol, aligns with the increasing preference for sustainable solutions across industries like cosmetics, pharmaceuticals, and agrochemicals. Furthermore, GBL’s integrated operations and feedstock control (using sugarcane as a primary input) provide it with a competitive edge in ensuring consistent supply and quality.
As global players prioritize bio-based products to meet regulatory requirements and consumer preferences, GBL stands to benefit from these tailwinds. Its investments in innovation and expansion, supported by its recent IPO, position it to scale operations and address the growing demand for sustainable chemicals and energy. The combination of strong market fundamentals, policy support, and the transition toward eco-friendly alternatives underscores a promising sector outlook and a robust growth trajectory for GBL in the evolving bio-economy landscape.
Business Segments
Godavari Biorefineries Limited (GBL) operates through the following business segments, leveraging its integrated biorefinery model:
Sugar Production: Sugar remains a core business segment for GBL, utilizing sugarcane as its primary feedstock. Sugar is produced in its Sameerwadi Facility (Karnataka), which processes sugarcane and generates by-products like molasses and press mud. The sugar produced is sold to domestic and international markets, catering to food and beverage manufacturers.
Ethanol and Alcohol Production: GBL is a pioneer in using sugarcane juice and syrup for ethanol production, catering to India’s growing ethanol-blending program. The company produces ethanol, rectified spirits, and industrial alcohol. Ethanol is supplied to oil marketing companies (OMCs) for fuel blending, beverage companies, and industrial sectors. The Indian government’s E20 target (20% ethanol blending by 2025) creates a strong demand for ethanol, bolstering this segment.
Bio-Based Chemicals: A high-growth segment, GBL produces a range of bio-based chemicals derived from renewable feedstocks. Includes ethyl acetate, bio-ethyl acetate, MPO (Mono Propylene Oxide), 1,3 Butylene Glycol, and crotonaldehyde. These chemicals are used in industries such as cosmetics, pharmaceuticals, agrochemicals, and food. GBL’s focus on sustainable bio-chemicals aligns with global demand for eco-friendly products and regulatory restrictions on hazardous chemicals.
Power Generation: GBL utilizes by-products like bagasse (sugarcane fiber) to generate renewable power. This segment supports the energy needs of GBL’s facilities and contributes surplus power to the grid. Renewable power generation underpins GBL’s commitment to sustainability and reducing its carbon footprint.
Fertilizers and Soil Conditioners: By-products like press mud are converted into organic fertilizers marketed under the brand ‘Bhumilabh.’ These fertilizers cater to farmers, promoting sustainable agriculture practices. This segment reflects GBL’s focus on creating value from waste, contributing to a circular economy.
Specialty Chemicals and Advanced Products (Emerging Focus): GBL is expanding its product portfolio to include specialty bio-chemicals with higher margins and advanced applications. Products like 1,3 butylene glycol, which are used in cosmetics, reflect GBL’s efforts to penetrate high-value markets.
Segment Contributions (FY25 Outlook)
Ethanol and bio-based chemicals are expected to be the key growth drivers, benefiting from favorable government policies and global demand for sustainable alternatives. Sugar continues to provide steady revenue, while power and fertilizers enhance value addition and operational efficiency.
GBL’s diversified portfolio and focus on sustainability, innovation, and renewable solutions position it as a leader in the bio-economy sector, addressing diverse market needs across energy, chemicals, and agriculture.
Key Subsidiaries and Their Information
Godavari Biorefineries Limited (GBL) operates through several key subsidiaries, each contributing uniquely to its growth, market diversification, and sustainability objectives:
Somaiya Agencies Pvt. Ltd. This subsidiary functions as GBL’s marketing and distribution arm, focusing on products such as sugar, ethanol, fertilizers, and bio-based chemicals. It strengthens GBL’s domestic and export operations by efficiently managing logistics and maintaining customer relationships.
Godavari Biorefineries BV (Netherlands) Based in Europe, this subsidiary serves as GBL’s international hub for bio-based chemicals. It is instrumental in marketing and distributing products in regions such as Europe and North America, targeting sectors like pharmaceuticals, cosmetics, and agrochemicals. Its strategic positioning ensures direct access to key global customers, enhancing GBL’s export revenue.
EcoEnergy Solutions Pvt. Ltd. This subsidiary is focused on renewable energy solutions, leveraging bagasse from sugar production for power generation. It supports GBL’s sustainability goals by increasing energy efficiency across facilities and contributing surplus power to the grid.
New Bio-Based Ventures As an emerging entity, this subsidiary specializes in advanced research and innovation in bio-based chemicals. Its primary focus is on developing high-value specialty chemicals like 1,3 butylene glycols, aligning with GBL’s strategy to penetrate niche, high-margin markets.
Bhumilabh Fertilizers Pvt. Ltd. Dedicated to organic fertilizers under the brand ‘Bhumilabh,’ this subsidiary utilizes by-products like press mud from sugar processing. It promotes sustainable farming practices while contributing to GBL’s circular economy model and diversifying its revenue streams.
These subsidiaries collectively enhance GBL’s global presence, focus on innovation, and support sustainability. By leveraging international markets through Godavari Biorefineries BV and fostering eco-friendly practices through EcoEnergy Solutions and Bhumilabh Fertilizers, GBL underscores its commitment to the bio-economy sector. Additionally, the New Bio-Based Ventures subsidiary positions GBL for future growth by prioritizing research and the development of specialized bio-based products.
Q2 FY25 Highlights
Godavari Biorefineries Limited (GBL) recently listed on both the NSE and BSE, with a final issue price of ₹352 per share. The ₹554.75 crore IPO comprised a fresh issue of ₹325 crore and an offer for sale of ₹229.75 crore. A significant portion of the proceeds, amounting to ₹240 crore, was allocated for debt repayment and prepayment, aiming to reduce principal and interest outflows. The remaining funds were earmarked for general corporate purposes, enhancing financial flexibility.
In its year-to-date financial performance, GBL reported revenue from operations at ₹320.95 crore, reflecting a 34% year-on-year growth. Despite the revenue growth, the company faced challenges, with negative EBITDA of ₹31.53 crore, loss before tax of ₹64.11 crore, and net loss of ₹75 crore, driven by operational hurdles.
One of the major impacts stemmed from the Indian government’s restriction on using sugarcane juice for ethanol production during the 2023-24 supply year. However, with the lifting of these restrictions effective November 1, 2024, ethanol production and sales are expected to rebound, contributing to improved performance.
Additionally, GBL has seen a surge in demand for bio-based chemicals, fueled by the global transition towards sustainable solutions. To capitalize on this, the company plans to expand its operations in select bio-based chemical segments by Q4 FY25.
A key positive outcome of the IPO is the planned repayment of ₹240 crore in debt, which will significantly reduce interest outflows, thereby improving free cash flows. These enhanced financial resources are strategically aligned to support expansion in the bio-based chemicals sector, starting in Q4 FY25.
In summary, while GBL faced short-term challenges, including regulatory impacts on ethanol production, the company is poised for recovery. The combination of government policy reversal, growing demand for bio-based chemicals, and strategic debt reduction positions GBL for long-term growth and a stronger foothold in sustainable product markets.
Financial Summary
INR in Cr.
Q2 FY25
Q1 FY25
Q2 FY24
Q-o-Q(%)
Y-o-Y(%)
Revenue from Operations
320.95
522.53
239.31
-38.6%
34.1%
Other Income
1.1
2.75
0.95
-60.0%
15.8%
Total Revenue
322.05
525.27
240.26
-38.7%
34.0%
Cost of Materials Consumed
92.49
128.33
104.96
-27.9%
-11.9%
Purchase of Finished Goods
4.88
5.19
4.04
-6.0%
20.8%
Changes in Inventories of Finished Goods and Work in Progress
171.57
317.91
76.83
-46.0%
123.3%
Gross Profit
53.11
73.84
54.43
-28.1%
-2.4%
GP %
16.50%
14.10%
22.70%
17.0%
-27.3%
Employee Benefits Expense
29.66
30.4
28.62
-2.4%
3.6%
Other Expenses
54.98
52.94
56.42
3.9%
-2.6%
EBITDA
-31.53
-9.49
-30.61
232.2%
3.0%
Depreciation and Amortisation Expense
12.3
12.57
15
-2.1%
-18.0%
EBIT
-43.82
-22.06
-45.61
98.6%
-3.9%
Finance Costs
20.29
19.57
19.55
3.7%
3.8%
Exceptional Items
0
0
0
0.0%
0.0%
PBT
-64.11
-41.64
-65.15
54.0%
-1.6%
Total Tax Expense
-10.89
-15.53
0
-29.9%
0.0%
Profit for the year
-75
-26.11
-65.15
187.2%
15.1%
PAT %
-23.30%
-5.00%
-27.10%
366.0%
-14.0%
EPS
-17.88
-6.22
-15.53
187.5%
15.1%
SWOT Analysis
Strengths
Industry Leadership: Maintains a strong position as a market leader.
Diverse Product Range: Offers a wide variety of products catering to multiple industries.
Integrated Operations: Ensures efficiency through seamless operations across the supply chain.
Renewable Energy Focus: Demonstrates commitment to sustainability and green energy initiatives.
Weaknesses
High Debt Burden: Faces challenges due to significant levels of debt.
Regulatory Dependency: Business performance is highly influenced by changes in government policies.
Financial Strain: Experiences ongoing difficulties in improving financial results.
Opportunities
Growth in Bio-Chemicals: Potential for expansion in bio-based chemical production.
Ethanol Boom: Increasing demand for ethanol presents lucrative growth avenues.
Strategic IPO Utilization: Opportunity to strengthen operations and finances through IPO proceeds.
Threats
Intense Market Competition: Faces stiff rivalry from existing and emerging players.
Raw Material and Price Volatility: Vulnerable to fluctuations in raw material costs and product prices.
Economic Uncertainty: Susceptible to the effects of global and domestic economic slowdowns.
NTPC Green Energy IPO is a book-built issue of Rs 10,000.00 crores. The issue is entirely a fresh issue of 92.59 crore shares.
About NTPC Green Energy Limited
Incorporated in April 2022, NTPC Green Energy Limited is a wholly-owned subsidiary of NTPC Limited. NTPC Green is a renewable energy company that focuses on undertaking projects through organic and inorganic routes. The largest renewable energy public sector enterprise, NTPC (National Thermal Power Corporation Limited), was incorporated on November 7, 1975. The company’s renewable energy portfolio includes solar and wind power, making it easier to generate clean energy. Additionally, the company aims to develop utility-scale renewable energy projects and projects for public sector undertakings (“PSUs”) and Indian corporations. As of June 30, 2024, the company has an energy capacity of 14,696 MW, consisting of 2,925 MW from operating projects and 11,771 MW from contracted and awarded projects. Compared to its peers, NTPC has achieved higher EBITDA margins and PTA margins in the last 2 years. The company is constructing 31 renewable energy projects in 7 states, totaling 11,771 MW. As of June 30, 2024, the workforce comprised 234 employees, and the company utilised the services of 45 contract labourers.
IPO Subscription Period
Open Date: November 19, 2024
Close Date: November 22, 2024
Allotment Date: November 25, 2024
Listing Date: November 27, 2024
Stock Exchanges: BSE and NSE
Pricing Details
Price Band: ₹102 – ₹108 per Share
Face Value: ₹10 per Share
Minimum Lot Size: 138 shares
Investment Requirement:
Retail Investors: Minimum ₹14,904 (138 shares)
Small Non-Institutional Investors (sNII): 14 lots (1932 shares) – ₹208,656
Big Non-Institutional Investors (bNII): 68 lots (9384 shares) – ₹1,013,472
Initiation of Refunds: Wednesday, November 26, 2024
Credit of Shares to Demat: Wednesday, November 26, 2024
Listing Date: Thursday, November 27, 2024
Cut-off time for UPI mandate confirmation: 5 PM on November 22, 2024
Book Running Lead Managers
Niva Bupa Health Insurance Limited has appointed prominent financial institutions as book-running lead managers for the IPO:
IDBI Capital Market Services Limited
IIFL Securities Limited
HDFC Bank Limited
Nuvama Wealth Management Limited
Kfin Technologies Limited has been designated as the registrar for the IPO.
Promoter Information
Promoter: The Promoters of the Company are the President of India, acting through the Ministry of Power, Government of India and NTPC Limited.
Shareholding:
Pre-Issue: 100%
Post-Issue: 89.01%
Financial Highlights
Revenue Growth: Increased by 11 folds from ₹170 crores (FY 2023) to ₹2037.66 crores (FY 2024)
Profit After Tax (PAT): Rose by 100%, reaching ₹344.72 crores in FY 2024
Net Worth: ₹6232 crores
Total Borrowing: ₹12796 crores
Key Performance Indicators (KPIs):
ROE: 7.39%
RoNW: 2.14%
P/BV: 9.89
EPS (Pre-IPO): ₹0.46
EPS (Post-IPO): ₹0.42
P/E Ratio (Pre-IPO): 234.97x
P/E Ratio (Post-IPO): 259.56x
IPO Objectives
The company proposes to utilise the Net Proceeds towards funding the following objects:
Investment in the wholly owned Subsidiary, NTPC Renewable Energy Limited (NREL), for repayment/ prepayment, in full or in part of certain outstanding borrowings availed by NREL
General corporate purpose
Subscription Status (As of November 19, 2024, 7:02:07 PM)
Waaree Energies Ltd. is a prominent player in the renewable energy sector and one of India’s largest manufacturers of solar PV modules. Established in 1989, Waaree Energies has built a strong presence in the solar energy value chain, encompassing manufacturing, project development, and EPC (Engineering, Procurement, and Construction) services. Waaree operates state-of-the-art solar PV module manufacturing facilities with a total installed capacity of 12 GW, making it one of the largest in India. Waaree has developed and commissioned over 600 MW of solar power projects and has a pipeline of projects across multiple geographies. In FY23, Waaree Energies achieved a revenue of approximately ₹4,000 crores, demonstrating consistent growth driven by its diversified business segments.
Industry Outlook
The Indian solar sector is projected to grow at a CAGR of 15-20% between 2023 and 2030. The solar energy industry in India is at a transformative stage, driven by the government’s ambitious renewable energy targets, favourable policies, and increasing private sector participation. As of 2024, India has achieved over 80 GW of installed solar capacity, making it one of the largest solar markets globally. The country aims to achieve 280 GW of solar capacity by 2030, as part of its broader target of 500 GW from non-fossil fuel sources. The PLI (Production Linked Incentive) Scheme for solar module manufacturing provides financial incentives to enhance domestic production and reduce import dependency, particularly on China. Initiatives like Green Hydrogen Mission and solar-based hybrid projects are creating new opportunities in the solar sector. India is targeting 40 GW of domestic manufacturing capacityby 2026 under the PLI scheme.
Financial Summary
INR Cr.
Q1 FY25
Q2 FY25
FY23
FY24
Revenue
3409
3574
6751
11398
EBITDA
552
525
836
1575
OPM
16%
15%
12%
14%
PBT
531
499
677
1734
Net Profit
401
376
500
1274
NPM
11.7%
10.5%
7.41%
11.2%
EPS
19.99
13.73
24.49
62.72
C&CE
3698
3813
1736
3779
Business Segments:
Solar PV Modules: Waaree Energies is the largest solar module manufacturer in India, with a 12 GW annual production capacity spread across multiple manufacturing facilities. It produces high-efficiency photovoltaic (PV) modules, including monocrystalline, polycrystalline, bifacial, and PERC (Passivized Emitter and Rear Cell) technologies.
Power Generation: In Power Generation business segment focuses on producing electricity from diverse sources, including renewable and conventional energy.
EPC Contracts: Provides turnkey solar solutions for utility-scale and rooftop projects. Waaree has successfully executed over 1 GW of EPC projects, including utility-scale solar farms and rooftop installations. End-to-end project management, from design and procurement to construction and commissioning.
Subsidiary Information:
Waaree Clean Energy Solutions Private Limited: WCESPL is currently engaged in the business of generating, trading, purchasing, marketing, selling, importing, exporting, producing, manufacturing, transmitting, distributing, supplying, exchanging, or otherwise dealing in all aspects of thermal, hydro, nuclear, solar, wind power and power generated through non-conventional / renewable energy sources.
Waaree Power Pvt Ltd: WPPL is currently engaged in the business of carrying out the business of generating, trading, purchasing, marketing, selling, importing, exporting, producing, manufacturing, transmitting, distributing, supplying, exchanging or otherwise dealing in all aspects of thermal, hydro, nuclear, solar, wind power and power generated through non-conventional / renewable energy sources.
Waaneep Power Pvt Ltd:WSPL One is currently engaged in the business of generating, trading, purchasing, marketing, selling, importing, exporting, producing, manufacturing, transmitting, distributing, supplying, exchanging, or otherwise dealing in all aspects of thermal, hydro, nuclear, solar, wind power and power generated through non-conventional / renewable energy sources.
Sangam Solar One Power Pvt Ltd: SSPL One is currently engaged in the business of generating, trading, purchasing, marketing, selling, importing, exporting, producing, manufacturing, transmitting, distributing, supplying, exchanging, or otherwise dealing in all aspects of thermal, hydro, nuclear, solar, wind power and power generated through non-conventional / renewable energy sources.
Waaree Renewables Technologies Ltd: WRTL is currently engaged in the business of generating, trading, purchasing, marketing, selling, importing, exporting, producing, transmitting, distributing, supplying, exchanging or otherwise dealing in all aspects of thermal, hydro, nuclear, solar, wind power and power generated through non-conventional / renewal energy sources.
Q2 FY25 & Business Highlights
Revenue of ₹3574 crore in Q2 FY25 down by 1.05% YoY from ₹3105 crore in Q2 FY24.
EBITDA of ₹525 crore in this quarter at a margin of 15% compared to 14% in Q2 FY24.
Profit of ₹376 crore in this quarter compared to a ₹321 crore profit in Q2 FY24.
Capex of 5.4GW Cell Mfg. expected to be operational by FY25, 1.6GW Module Mfg. in USA expected to be operational by FY25.
The current order book for the Company stands at approx. 20GW, and presently has 13.3 GW capacities. It has 5.4 GW Cell Manufacturing Facility at Chikli, 6 GW integrated facility at Odisha. And it has production volume of 3.3GW.
The Solar and Batteries cost has been declined by almost 80% from 2012 till now.
The order book as per geography is 27.5% domestic and 72.5% overseas. And till now, Pan India it has total 372 franchisees.
SWOT Analysis
Strengths:
Market Leadership: A dominant position in the industry ensures competitive advantage and strong market share.
Technological Edge: Advanced technologies provide an edge over competitors and drive innovation.
Strong Brand Presence: A well-established brand fosters customer trust and loyalty.
Policy Support: Favorable government policies and incentives promote growth and stability.
Weaknesses:
High Dependency on Imports: Reliance on imported components increases vulnerability to supply chain disruptions.
Limited Product Diversification: A narrow product portfolio limits the ability to tap into diverse customer needs.
Capital-Intensive Operations: High operational costs can strain resources and profitability.
Intense Competition: Fierce market competition pressures pricing and margins.
Opportunities:
Rising Solar Demand: Increasing adoption of renewable energy drives growth potential.
Energy Storage Solutions: Expanding into storage technology complements solar offerings.
Global Expansion: Entering international markets opens new revenue streams.
Backward Integration: Controlling supply chains enhances efficiency and cost management.
Threats:
Regulatory and Policy Risks: Changes in regulations or government policies can impact operations.
Price Volatility: Fluctuations in raw material costs affect pricing and profitability.
Global Trade Wars: Tariffs and trade restrictions disrupt supply chains and market access.
Economic Uncertainty: Economic slowdowns or instability could hinder growth prospects.
Swan Energy Ltd. (SEL), formerly known as Swan Mills Limited, was established on February 22, 1909, and underwent a major transformation in 1992 when it was acquired by the Dave and Merchant families from the J.P. Goenka Group. Today, SEL operates across three core verticals: Textiles, Energy, and Construction & Real Estate, marking its presence in sectors critical to India’s economic growth. During the 1990s, SEL faced financial challenges and was brought under the Board for Industrial and Financial Reconstruction (BIFR). The revival plan focused on reviving its spinning unit, disposing of surplus land for modernization, and resuming operations. By 1993-94, SEL achieved profitability, and in 1995, BIFR declared it financially sound. Initially, its Textile Division relied on job work operations, accounting for 80% of mill processing, and expanded into exports, supplying to Marks & Spencer, a leading European retailer.
In the Energy Sector, SEL made significant advancements with the development of India’s first Greenfield LNG Port Terminal at Jafrabad, Gujarat, through its subsidiaries Swan LNG Private Ltd. (SLPL) and Triumph Offshore Private Ltd. (TOPL). The 10 MMTPA terminal, operational since FY 2021, utilizes the Floating Storage and Regasification Unit (FSRU) ‘Vasant 1’, deployed in 2020. SEL secured long-term agreements with IOC, BPCL, ONGC, and GSPC for terminal utilization and collaborated with Mitsui OSK Lines (MOL) of Japan to enhance LNG operations. Additionally, SEL signed charter hire agreements with companies in Hong Kong and Ghana, showcasing its growing international presence in LNG. In Real Estate, SEL has strategically invested in high-value assets. In FY 2014, it acquired a 0.3 million sq. ft. IT Park in Whitefield, Bangalore, leased to MNCs. It also developed Technoya Park in Hyderabad, leasing 2.92 lakh sq. ft. to Mahataa Information India Pvt. Ltd., generating an annual rent of ₹14 crore, which was utilized to service loans. SEL has also executed significant projects, such as a ₹459 crore LNG terminal infrastructure agreement with Black & Veatch Private Limited in 2018. With a focus on infrastructure development, sustainability, and sectoral diversification, SEL has positioned itself as a key player in India’s growth and development initiatives.
Industry Outlook
Swan Energy operates in three key sectors—Energy (LNG Infrastructure), Textiles, and Real Estate—all of which are poised for significant growth. The LNG infrastructure industry, where Swan Energy is a key player, is projected to grow at a CAGR of 8-10% globally through FY25, driven by the increasing adoption of natural gas as a cleaner fuel and rising investments in Floating Storage and Regasification Units (FSRUs). In India, the LNG sector is expected to expand at a CAGR of 11-13%, supported by the government’s initiatives to enhance natural gas’s share in the energy mix from 6% to 15% by 2030, aligning with its net-zero emission goals. Swan Energy’s Jafrabad Greenfield LNG Terminal positions it to capitalize on this growth, particularly as demand for imported LNG rises due to domestic production shortfalls.
The real estate sector in India is experiencing robust recovery, with a projected CAGR of 8-9% until FY30, fueled by urbanization, increasing demand for commercial spaces, and government initiatives like Smart Cities Mission. Swan Energy’s investments in high-value IT parks and commercial properties, such as Technoya Park in Hyderabad and its Bangalore IT Park, place it in a strong position to benefit from this trend.
In the textile sector, where Swan Energy has historical roots, the Indian textile industry is expected to grow at a CAGR of 10-12% by FY25, driven by rising exports, increased consumer spending, and growing demand for sustainable fabrics. Despite Swan Energy’s reduced focus on textiles, its legacy operations provide stability and diversification.
Overall, with strong tailwinds in the LNG, real estate, and textile sectors, Swan Energy is well-positioned for sustained growth. The company’s investments in infrastructure, clean energy solutions, and high-value real estate assets align with India’s long-term economic and sustainability goals, making it a potential leader in its operating segments.
Business Segments
Swan Energy operates through a diverse range of business segments, each contributing uniquely to its overall revenue and strategic vision.
The Textile Segment forms the company’s historical foundation, focusing on the processing and manufacturing of fabrics. This segment thrives on job work operations, serving long-standing clients and generating stable revenues. Additionally, it has supported export initiatives, previously catering to high-profile clients like Marks & Spencer.
The Energy Segment represents Swan Energy’s flagship business, driving its growth in India’s clean energy transition. This segment includes the operation of India’s first Greenfield LNG Port Terminal at Jafrabad, Gujarat, managed through subsidiaries Swan LNG Private Ltd. (SLPL) and Triumph Offshore Private Ltd. (TOPL). By utilizing Floating Storage and Regasification Units (FSRUs) and partnering with major companies like IOC, BPCL, and ONGC, the energy segment plays a vital role in providing LNG infrastructure and clean energy solutions.
In the Construction and Others Segment, Swan Energy focuses on infrastructure development and construction projects linked to its real estate and energy ventures. This segment is critical for executing large-scale industrial developments, such as the LNG port. The Distribution & Development Segment complements this by handling the distribution of resources like LNG and engaging in real estate development, aligning with India’s expanding infrastructure and urbanization needs.
The Warehousing Segment supports industries requiring logistical solutions through strategically located commercial warehousing facilities. These facilities generate consistent income by attracting corporate clients with long-term leasing agreements. The Manufacturing Segment encompasses Swan Energy’s legacy fabric manufacturing operations alongside other industrial production activities, which are bolstered by modernized facilities to remain competitive.
Lastly, the Power Generation Segment focuses on sustainable energy production, supporting the company’s operations while adhering to its commitment to clean and efficient energy solutions. Collectively, these diversified business segments enable Swan Energy to maintain a balanced revenue portfolio, mitigate risks, and align itself with India’s economic growth and sustainable development goals.
Key Subsidiaries and Their Information
Swan Energy Limited operates through several subsidiaries, each contributing uniquely to its diverse business portfolio across energy, real estate, and infrastructure sectors:
Cardinal Energy and Infrastructure Private Limited (Wholly Owned Subsidiary): It focuses on energy infrastructure projects that align with Swan Energy’s mission of driving clean energy adoption.
Pegasus Ventures Private Limited (Wholly Owned Subsidiary): It is engaged in investment activities and plays a strategic role in supporting Swan Energy’s financial and operational goals.
Swan LNG Private Limited (Subsidiary): A flagship subsidiary managing India’s first Greenfield LNG Port Terminal at Jafrabad, Gujarat. It specializes in Floating Storage and Regasification Unit (FSRU) operations and has partnered with major players like IOC, BPCL, and ONGC for capacity utilization.
Triumph Offshore Private Limited (Wholly Owned Subsidiary); It is the key player in the construction and operation of LNG infrastructure, including FSRUs. Collaborates with global entities such as Hyundai Heavy Industries for shipbuilding and Mitsui OSK Lines for project execution.
Swan Mills Private Limited (Wholly Owned Subsidiary): It represents the company’s textile operations and holds legacy value, contributing to Swan Energy’s roots in fabric manufacturing and processing.
Veritas (Hazel Infra Limited (Subsidiary)It specializes in real estate development and infrastructure projects, bolstering Swan Energy’s presence in commercial and residential properties.
Swan Imagination Private Limited (Wholly Owned Subsidiary): It operates in real estate and infrastructure management, focusing on leasing and development of commercial properties.
Wilson Corporation FZE (Foreign Wholly Owned Subsidiary): It’s a foreign subsidiary based in the UAE, playing a role in international ventures and investments, though currently non-operational.
These subsidiaries form the backbone of Swan Energy’s diversified operations, enabling it to excel in clean energy infrastructure, textiles, and real estate development, while strategically exploring global opportunities.
Q2 FY25 Highlights
Swan Energy’s Q2 FY25 consolidated results reveal a challenging quarter, marked by revenue and profitability pressures.
The total revenue for the quarter stood at ₹1,032.19 crore, a decline of 15.6% YoY compared to the same period last year. The net profit also dropped significantly by 59.4% YoY to ₹67.13 crore, impacted by higher expenses and operational challenges. This contrasts with the company’s robust year-over-year growth trend in recent fiscal periods, where Swan Energy reported substantial annual revenue growth
In Q2 FY25, Swan Energy’s revenue experienced declines across key segments:
Textile Segment: Revenue fell by 54.32% year-on-year to ₹25.41 crore.
Energy Segment: Witnessed a significant 65.13% decline, reaching ₹65.99 crore.
Construction Segment: Revenue dropped to ₹25.27 crore, down from ₹37.46 crore in Q2 FY24.
The company’s Energy segment, which includes its LNG operations, remains a core contributor to its performance. However, it faced headwinds due to market conditions and operational costs. The Textile segment contributed to stabilizing revenue streams but remains a smaller part of the overall business. The Real Estate segment, known for leasing high-value commercial properties, continued to provide recurring income
Management commentary during the results highlighted the focus on long-term growth through LNG infrastructure investments and real estate portfolio optimization. Despite the quarterly setback, Swan Energy emphasized its strategy of leveraging strategic partnerships and innovative solutions to strengthen its position in clean energy and real estate
Financial Summary
INR in Cr.
Q2FY25
Q1FY5
Q2FY24
Q-o-Q (%)
Y-o-Y (%)
Net Sales
1032.19
1141.74
1223.26
-9.6%
-15.6%
Other Income
31.32
19.82
6.85
58.0%
357.2%
Total Expenditure
940.45
788.36
993.4
19.3%
-5.3%
Operating Profits
217.08
453.34
322.15
-52.1%
-32.6%
Interest
65.66
52.63
58.34
24.8%
12.5%
PBT
57.4
320.57
178.37
-82.1%
-67.8%
Tax
-9.73
52.89
12.81
-81.6%
-24.0%
Net Profit
67.13
267.67
165.57
-74.9%
-59.5%
Adj EPS in Rs.
2.28
8.57
6.69
-73.4%
-65.9%
SWOT Analysis
Strengths:
Strong Outlook: A robust growth trajectory driven by key projects and market demand.
Pioneering LNG Infrastructure: Cutting-edge facilities, making the company a leader in LNG infrastructure development.
Strong Partnerships: Strategic alliances with key players strengthen market position and operational efficiency.
Diversified Business Portfolio: Operations span across LNG, real estate, and textiles, reducing dependency on a single sector.
Weaknesses:
Limited Presence in Core LNG Markets: The company’s reach in major global LNG markets remains constrained.
Dependence on Key Projects: Over-reliance on a few critical projects poses risks to revenue consistency.
Lower Focus on Textiles: Neglected growth in the textile segment affects overall business balance.
Regulatory and Environmental Challenges: Navigating stringent regulations impacts operations and costs.
Opportunities:
Rising Demand for LNG: Increasing global LNG consumption creates significant growth prospects.
Real Estate Expansion: Opportunities in the booming real estate sector add to revenue streams.
Government Initiatives: Supportive policies and incentives offer avenues for accelerated growth.
International Collaborations: Potential for partnerships with global players to expand market reach.
Threats:
Market Competition: Intense rivalry in the LNG and real estate sectors may impact profitability.
Economic Volatility: Fluctuations in global and domestic markets pose financial risks.
Environmental Regulations: Increasingly stringent standards could escalate compliance costs and operational hurdles.
Vardhman Holdings Limited (formerly known as Vardhman Spinning & General Mills Ltd) was incorporated in 1962 and began production in 1965. Promoted by V.S. Oswal and R.C. Oswal, it is part of the Vardhman Group, which includes notable entities like Mahavir Spinning Mills and Vardhman Polytex. Initially focused on textile manufacturing, the company has evolved into an entity engaged in lending and investing activities, with a significant presence in the capital markets.
In November 1992, the company raised Rs. 47.82 crore through a Rights Issue of 14% PCDs to fund expansion and meet long-term working capital needs. Historically, its portfolio included cotton and worsted blended yarn, cotton yarn, and fabric, serving both domestic and international markets such as the UK, Spain, Germany, Italy, Hong Kong, Indonesia, Japan, the US, and African countries. Vardhman became an Export House in 1990-91 and earned ISO 9002 certification for its textile mill, demonstrating its commitment to quality.
Key milestones include the sale of its steel unit in Faridabad to Mahavir Spinning Mills in 1995 and the commencement of Auro Textiles at Baddi, Himachal Pradesh, in 1999, in collaboration with Tokai Senko of Japan, achieving an annual capacity of 30 million meters. The company expanded further by commissioning a 100% EOU Spinning Unit in Ludhiana in 2002 and modernizing its dyeing unit at Baddi, enhancing capacity to 9 tons per day.
A pivotal transformation occurred in 2004-05 through a Scheme of Arrangement and Demerger, which transferred the textile business to Mahavir Spinning Mills Limited. The remaining assets comprised investments in group company shares, leading to its rebranding as Vardhman Holdings Limited in March 2006. Shareholders received 8 equity shares of Mahavir Spinning Mills and 2 equity shares of Vardhman Holdings for every 10 shares held. As of now, Vardhman Holdings operates primarily as an investment company, leveraging its robust financial history and strategic restructuring to deliver sustained growth and value creation.
Industry Outlook
Vardhman Holdings, as an investment and lending entity, is strongly tied to the financial health of its group companies in the textile sector and the overall investment landscape. The Indian financial and investment industry is expected to grow at a CAGR of 12-14% by FY25, supported by rising capital market participation, digitalization, and increasing institutional investments. Simultaneously, the textile industry, a core focus of Vardhman’s portfolio, is projected to grow at a CAGR of 10-12% by FY25, driven by global demand, government incentives like PLI, and a shift towards sustainable, value-added textiles. Vardhman Holdings’ low debt, efficient capital allocation, and strategic investments in high-growth segments like technical textiles and branded apparel position it well for long-term sustainable returns. Moreover, with India’s textile exports projected to contribute significantly to the industry’s target of $350 billion by FY30, Vardhman Holdings stands to benefit from portfolio diversification and growth in domestic and international markets, aligning with the broader trends in the financial and textile ecosystems.
Business Segments
Vardhman Holdings Limited (VHL) primarily operates in the investment and lending domain, managing its portfolio through two major segments:
Investment Activities: VHL’s core business involves managing its investments, primarily in group companies like Vardhman Textiles, Vardhman Polytex, and other entities in the Vardhman Group. These investments form a significant part of its asset base. The company’s strategy revolves around long-term capital appreciation through its stake in companies engaged in textiles, yarn production, and fabric manufacturing, sectors that are integral to India’s economy. Returns from these investments are a key contributor to the company’s profitability and stability, driven by dividends, interest income, and capital gains.
Lending Activities: VHL also engages in lending operations, providing short-term and long-term loans to group companies and external borrowers. The lending activities support the working capital requirements and expansion needs of its portfolio companies, ensuring smooth operations and growth. This segment generates interest income, offering a stable and predictable revenue stream to complement its investment returns.
Key Subsidiaries and Their Information
VHL has a strategic relationship with associate companies primarily within the Vardhman Group, which focus on various aspects of the textile and yarn manufacturing ecosystem. Below are the key entities and their contributions:
Vardhman Textiles Limited: It’s a flagship company of the Vardhman Group, it is one of India’s largest integrated textile manufacturers. Produces and exports cotton yarn, synthetic yarn, and woven fabrics for global and domestic markets. A major contributor to VHL’s investment portfolio, providing consistent dividend income and value appreciation.
Vardhman Spinning and General Mills Limited: Itspecializes in spinning high-quality cotton and blended yarns for the textile industry. Supplies yarns used in knitwear and woven fabrics, complementing the operations of Vardhman Textiles. Enhances VHL’s exposure to the upstream segment of the textile value chain.
Vardhman Special Steels Limited: It focuses on manufacturing specialty steel products for automotive, engineering, and industrial applications. Supplies critical steel components to automobile OEMs and precision engineering firms globally. Diversifies VHL’s portfolio beyond textiles, leveraging growth in the automotive and industrial sectors.
Vardhman Acrylics Limited: It is engaged in manufacturing acrylic fiber and blends used in textiles, home furnishings, and industrial fabrics. Supplies high-performance fibers with applications in winter clothing and upholstery fabrics. Strengthens VHL’s footprint in specialized textile segments with growth potential.
Vardhman Polytex Limited: It manufactures yarns and fabrics and caters to domestic and export markets. Produces a variety of yarns used in textiles, such as blended, dyed, and grey yarns. A niche player that supports the group’s vertical integration strategy within textiles.
These subsidiaries and associates form a diversified portfolio for VHL, allowing it to capitalize on the growth potential of the textile and specialty material industries while maintaining a low-risk, steady-income approach.
Q2 FY25 Highlights
In the quarter ended September 2024, Vardhman Holdings reported a net profit decline of 20.26% YoY, standing at ₹49.38 crore, compared to ₹61.93 crore in September 2023. The company experienced a significant sales decline of 75.55% YoY, with revenue dropping to ₹7.40 crore from ₹30.27 crore in the same quarter last year.
The Operating Profit Margin (OPM) contracted sharply, falling from an exceptionally high 97.56% in September 2023 to 65.95% in the current quarter. Similarly, Profit Before Depreciation and Taxes (PBDT) and Profit Before Tax (PBT) both declined by 10% YoY, from ₹68.87 crore to ₹62.09 crore.
Key Takeaways:
Sales Drop: The sharp decline in sales reflects weaker performance in core revenue-generating activities.
Profit Resilience: Despite reduced revenue, profitability remains relatively strong, supported by efficient cost management and investment returns.
Margin Compression: The decrease in OPM indicates lower operating efficiency or one-off impacts during the quarter.
Overall, while investment income has helped sustain profits, the significant sales decline underscores potential challenges in operational performance or market dynamics, requiring close monitoring of upcoming quarters.
Financial Summary
INR in Cr.
Q2FY25
Q1FY25
Q2FY24
Q-o-Q (%)
Y-o-Y (%)
Total Income
7.4
6.6
30.27
12.1%
-75.6%
Operating Expenses
2.52
1.28
0.74
96.9%
240.5%
Operating profit
4.88
5.32
29.53
-8.3%
-83.5%
Other Income
0.48
0.44
0.51
9.1%
-5.9%
PBT
62.09
74.4
68.87
-16.5%
-9.8%
Tax
12.71
1.27
6.94
900.8%
83.1%
Net Profit
49.38
73.13
61.93
-32.5%
-20.3%
Basic EPS (Rs.)
154.73
229.24
194.03
-32.5%
-20.3%
SWOT Analysis
Strengths:
Backed by a Strong Parent Group, ensuring stability and trust.
A Diversified and Robust Investment Portfolio offering steady returns.
Maintains a debt-free status, enhancing financial resilience.
Strategic alliances that provide growth opportunities and market access.
Techno Electric & Engineering Company Limited (TEECL) founded in 1963 with headquarters in Kolkata, is a leading Indian company specialising in Engineering, Procurement, and Construction (EPC) services for the power sector. It also has a strong presence in Renewable Energy through its wind power generation segment. It has expertise in developing power transmission, distribution, and substation projects and focuses on the efficient execution of turnkey solutions for high-voltage substations and industrial electrification. Operates wind energy projects with an installed capacity of 129.9 MW spread across Tamil Nadu. Techno Electric aims to expand its portfolio in renewable energy and smart grid technology while also focusing on digital transformation in the power sector. The company is strategically positioned to benefit from India’s push for green energy.
Industry Outlook
India’s power demand is expected to grow at a CAGR of 6-7% over the next decade due to population growth, industrial expansion, and increasing per capita energy consumption. India’s power sector is the third-largest in the world in terms of installed capacity, standing at 425 GW (as of 2024). Renewable energy accounts for 40% of the total installed capacity, with solar and wind energy playing pivotal roles. Thermal Power still dominates the generation capacity but is witnessing a decline due to environmental regulations and rising fuel costs. Renewable energy capacity is projected to reach 500 GW by 2030, aligning with India’s commitment to achieving net-zero emissions by 2070. Smart grid technology is expected to grow at a CAGR of 10%+ in India. Companies like Techno Electric are well-positioned to benefit from this transformation due to their focus on renewable energy and smart grid solutions.
Financial Summary
INR Cr.
Q1 FY25
Q2 FY25
FY23
FY24
Revenue
375
441
830
1502
EBITDA
52
70
87
210
OPM
14%
16%
11%
14%
PBT
117
105
233
319
Net Profit
98
94
187
268
NPM
26.1%
21.3%
22.5%
17.8%
EPS
9.12
8.10
17.36
24.98
C&CE
162
191
146
137
Business Segments:
Power Generation: TEECL offers turnkey solutions for captive power plants, specializing in the balance of plant and flue gas desulphurization (FGD).
Transmission & Distribution: The company excels in EHV substations up to 765 kV, advanced metering infrastructure, and STATCOM installations, ensuring robust transmission and efficient distribution networks.
Data Centres: TEECL provides comprehensive solutions for data centers, encompassing design and engineering, civil and structural works, fire protection systems, water and allied systems, and plant electrical and illumination systems.
Industrial Sector: In the industrial domain, TEECL offers MEP works, procurement of long-lead equipment, and solutions for power-intensive industries. The company specializes in executing less capital-intensive projects with a high risk-reward ratio, including captive waste heat recovery and conventional power plants of up to 200 MW on a turnkey basis.
Subsidiary Information:
Techno Infra Developers Pvt Ltd: It focuses on Renewable energy development and infrastructure projects. Owns and operates wind energy assets that contribute to TEECL’s clean energy portfolio. It facilitates the expansion of renewable energy capacity for long-term sustainability.
Techno Green Energy Ltd: Manages wind farms in Tamil Nadu, supporting TEECL’s clean energy initiatives. Contributes to steady cash flows through Power Purchase Agreements (PPAs) and it focuses on wind energy projects for the parent company.
Techno Wind Power Pvt Ltd:It focuses on the development and operation of wind energy farms and its role is to expand TEECL’s renewable energy capacity in high-wind potential regions.
Techno Power Transmission Ltd:It implements power transmission projects in partnership with utilities. And focuses on EPC and power transmission. Enhances TEECL’s ability to secure and execute high-value contracts.
Techno Renewable Energy: It manages solar and wind energy assets to align with the renewable energy push and focus on renewable projects for the parent company. Positions TEECL as a significant player in India’s green energy transition.
Q2 FY25 & Business Highlights
Revenue of ₹441 crore in Q2 FY25 is down by 4.51% YoY from ₹462 crore in Q2 FY24.
EBITDA of ₹70 crore in this quarter at a margin of 16% compared to 17% in Q2 FY24.
Profit of ₹94 crore in this quarter compared to a ₹74 crore profit in Q2 FY24.
We have already received 4 sites from Adani and Power Grid, and we are confident to make it up in batch 2 as we have a robust order book and clear visibility of additional opportunities in the T&D sector.
There has been delay in handing over of sites by various clients like Power Grid, IndiGrid, Apraava or Adani.
The current investment and cash are around INR 2600 crores, about INR2.25 per share.
The present peak growth demand is about 240 gigawatts or more, and this is likely to be 400 gigawatts by 2030. Thus, per capita consumption will be no less than 1,700 units by 2030 as against 1,200 units today.
We have an extremely robust order book of around INR 9725 crores as of September 2024 and ₹642 crore as booked in this quarter.
SWOT Analysis:
Strengths:
Diverse business portfolio catering to multiple sectors.
Robust financial stability ensures resilience.
Market leadership in renewable energy initiatives.
Torrent Power Ltd. is a leading integrated power utility in India, engaged in generation, transmission, and distribution of electricity. The company is part of the Torrent Group, a major business conglomerate. Known for its focus on efficiency and sustainability, Torrent Power operates across the power value chain, offering a diversified mix of thermal, renewable, and gas-based energy generation. Torrent Power’s generation portfolio includes a growing share of renewables, aligning with India’s green energy goals. It has more than 8200 employees working for the success of company. Torrent Power has a significant footprint in Gujarat, Maharashtra, Uttar Pradesh, and Madhya Pradesh. With India’s increasing focus on renewable energy, urban electrification, and energy efficiency, Torrent Power is well-positioned to capitalize on these trends. The company aims to increase its renewable capacity to 2,500 MW by 2025and enhance its digital and operational capabilities in power distribution and transmission.
Industry Outlook
India’s power industry is a vital component of its infrastructure, supporting the country’s rapid economic growth and urbanization. With growing demand for reliable and sustainable energy, the industry is evolving to address supply constraints, improve efficiency, and embrace renewable energy sources. The Central Electricity Authority (CEA) projects India’s power demand to reach around 817 GW by 2030, up from 416 GW in 2023, fuelled by increased residential and industrial consumption. India aims to achieve 500 GW of non-fossil fuel-based energy capacity by 2030 and Net Zero emissions by 2070. The Revamped Distribution Sector Scheme (RDSS) introduced in 2021 focuses on improving DISCOM performance with a ₹3 trillion investment, aimed at reducing AT&C losses to below 15% by 2025. Despite renewable energy growth, coal continues to account for 57% of India’s energy mix.
Financial Summary
INR Cr.
Q1 FY25
Q2 FY25
FY23
FY24
Revenue
9034
7176
25694
27183
EBITDA
1858
1207
4789
4596
OPM
21%
17%
19%
17%
PBT
1315
689
3041
2583
Net Profit
996
496
2165
1896
NPM
11.09%
6.91%
8.42%
6.97%
EPS
20.23
10.01
44.06
38.14
C&CE
423
446
344
419
Business Segments:
Transmission & Distribution: The Company is a licensed operator for electricity distribution in Ahmedabad, Gandhinagar, Surat, Dahej SEZ, etc. aggregating to 2,050 sq. km of area. It distributes nearly 30 billion units of power to over 4.13 million customers. The company operates 355 km of 400 kV and 128 km of 220 kV double circuit transmission lines and is building two new transmission assets of 104 km 400 kV for Rs. 1,300 Cr.
Thermal Power Generation: The Company has an aggregate installed thermal power generation capacity of 3,092 MW, including 2,730 MW of gas-based and 362 MW of coal-based power plants.
Renewable Power Generation: The Company has a solar power generation capacity of 2,091 MWp including 403 MWp operational and 1,688 MWp under development, further, it has a wind power generation capacity of 2,260 MW, comprising 921 MW operational and 1,339 MW under development.
Subsidiary Information:
Torrent Power Grid Limited (TPGL): It is currently operate 354 km of 400 kV double-circuit transmission lines and 128 km of 220 kV double-circuit transmission lines for the transmission of power generated at our gas-based power plants to various off-take centres.
Solapur Transmission Ltd: Power transmission, specifically the development and operation of transmission infrastructure in and around Solapur, Maharashtra. Itplays a crucial role in improving grid reliability and supporting the transmission of electricity in the region, enabling Torrent Power to deliver efficient services. The work includes setting up, managing, and maintaining transmission lines and substations to ensure stable electricity supply and reduce transmission losses.
Torrent Pipavav Generation Ltd:It is a subsidiary of the company and a joint venture between the Company and Gujarat Power Corporation Limited (“GPCL”), had made payments in nature of compensation for the acquisition of private land as per the court orders in Amreli, Gujarat for the purpose of developing a coal-based power plant of 1,000+ MW.
Torrent Solargen Ltd:It focuses on renewable energy, specifically in the domain of solar power generation. It plays a crucial role in Torrent Power’s strategy to diversify its energy portfolio and enhance its presence in the renewable energy sector. It aligns with India’s renewable energy goals under government policies like the National Solar Mission.
And there are other subsidiaries for city wise production and distribution like in Bhiwandi, Surat, Ahmedabad, etc. and Torrent Urja subsidiaries for renewable and solar energy distributions.
Q2 FY25 & Business Highlights
Revenue of ₹7176 crore in Q2 FY25 up by 3.09% YoY from ₹6961 crore in Q2 FY24.
EBITDA of ₹1207 crore in this quarter at a margin of 17% compared to 18% in Q2 FY24.
Profit of ₹496 crore in this quarter compared to a ₹543 crore profit in Q2 FY24.
The thermal generation segment had a revenue of ₹1833 crore in Q2 FY25 vs ₹1963 crore in Q2 FY24.
The Power Transmission and Distribution segment had a revenue of ₹6596 crore in Q2 FY25 vs ₹6352 crore in Q2 FY24.
The Thermal Generation segment had a revenue of ₹291 crores in Q2 FY25 vs ₹366 crores in Q2 FY24.
The company has installed a total capacity of 4850 MWp but by adding the pipeline the capacity increases to 7559 MWp.
The Solapur Transmission project (in the new SPV) for the evacuation of 1,500 MW RE power was won by the company through the Tariff-Based Competitive Bidding (TBCB) process, and the expected project cost is ₹470 crore.
Sites/projects of 8.4 GW are under the planning stage in the states of Maharashtra and Uttar Pradesh and received LOA from MSEDCL for a 2,000 MW/16,000 MWh pumped hydro storage project in Raigad District with energy storage capacity for 40 years.
One of the reasons for low PAT is due to an increase in finance & depreciation costs due to capex & commissioning of additional renewable generation capacity.
SWOT Analysis: A Closer Look at Key Business Dynamics
Strengths:
Efficient Distribution: Demonstrates robust supply chain and energy delivery mechanisms.
Integrated Operations: Combines generation, transmission, and distribution for seamless functionality.
Strong Financial Position: Solid financial health supports sustained growth and investment opportunities.
Weaknesses:
Geographic Concentration: Limited presence in diverse markets may restrict growth potential.
Regulatory Changes: Vulnerable to shifts in government policies and regulations.
Debt Levels: Higher borrowing could pose financial strain.
High Project Expenditure: Significant investments required for infrastructure and expansion.
Opportunities:
Renewable Energy Expansion: Growing focus on sustainable energy solutions presents untapped potential.
Grid Modernization: Technological upgrades and innovation in grid systems can enhance efficiency.
Global Collaborations: Partnerships with international players can open new avenues for growth.
Threats:
Competition: Intense rivalry in the energy sector can impact market share.
Coal Supply and Price Fluctuation: Dependence on coal exposes the business to supply and cost volatility.
Climate Risks: Environmental challenges and stricter climate regulations may pose operational hurdles.
Zydus Lifesciences Ltd. (formerly known as Cadila Healthcare Ltd.) is one of India’s leading pharmaceutical companies, known for its diverse portfolio in both generics and specialty medications. Established in 1952, Zydus has a strong presence across multiple therapeutic areas, including cardiovascular, gastroenterology, pain management, diabetes, oncology, and dermatology. The company is also a significant player in bio similar, vaccines, and novel therapies, catering to both domestic and international markets. Operates across 50+ countries, with a significant focus on the U.S. and Indian markets. It is among top 5 pharmaceutical companies in India, with a share of around 4-5% in the Indian pharma market. It operates 25+ manufacturing facilities worldwide, including U.S. FDA and WHO-GMP certified plants, ensuring compliance with international quality standards.
Industry Outlook
The Indian pharmaceutical industry is one of the largest globally, with India positioned as a major supplier of generic medicines worldwide. The industry, valued at approximately $50 billion in 2023, is expected to grow at a compound annual growth rate (CAGR) of around 10-12%, driven by increasing healthcare needs domestically and sustained demand for affordable generics in international markets. Healthcare expenditure is increasing, with the government aiming to raise public health spending to 2.5% of GDP by 2025, which will benefit the pharma sector. India is the largest provider of generic medicines, supplying around 20% of global generics. With over 3,000 pharma companies and 10,000+ manufacturing facilities, India continues to dominate in terms of affordable drug exports, particularly to the U.S., Europe, and other emerging markets. The Government of India has introduced the Production Linked Incentive (PLI) scheme. Increased competition from both Indian and global players is intensifying in generic and speciality segments. Mergers and acquisitions are common as companies seek to scale and expand product portfolios.
Financial Summary
INR Cr.
Q1 FY25
Q2 FY25
FY23
FY24
Revenue
6208
5237
17237
19547
EBITDA
2084
1461
3860
5384
OPM
34%
28%
22%
28%
PBT
1900
1271
2585
4832
Net Profit
1482
920
2092
3973
NPM
23.9%
17.5%
12.1%
20.3%
EPS
14.11
9.06
19.37
38.36
C&CE
1238
1594
573
1105
Business Segments:
India Formulations: It is a branded prescription business in categories of therapies like Pain, Anti-infective, Respiratory, Oncology, and many other segments. It has 7 brands which were ranked among world’s top 300 brands. 37 brands had value between ₹25-₹50 crore, 21 brands between ₹50-₹100 crore and 10 were having yearly ₹100+ crore.
Consumer Wellness: The Company has many successful brands in the consumer wellness segment like Glucon-D, nycil, Sugar-Free, Complan, etc. And a skincare brand called Everyuth naturals. It is in category of personal care and food and nutrition and has recently acquired Naturell Pvt Ltd. A leading player in the healthy snack category.
US Formulations: The company predominantly operates in the generics and specialty segments of the market through its wholly-owned subsidiary, Zydus Pharmaceuticals USA Inc. In this quarter company had filed 8 ANDA and received approvals of 9 ANDAs. It has entered into an exclusive licensing and supply agreement with Viwit Pharmaceuticals for 2 Gadolinium-based Magnetic Resonance Imaging (MRI) injectable, contrast agents.
International Market Formulations: In the emerging markets space, the Company predominantly operates in the branded generics segment with Cardiology, Diabetology, Neuro-Psychiatry and Pain Management being the focused therapeutic areas. The Company keeps on evaluating partnership opportunities with local players in select geographies as it looks to expand its footprint in different emerging market countries
Subsidiary Information:
Zydus Wellness Ltd: The Company’s subsidiary spearheads the group’s operations in the wellness space. ZWL operates in two different segments viz. personal care segment and food and nutrition segment and has a portfolio of category-leading health and wellness products. Five out of the six brands of the Company continue to hold leadership positions in their respective categories
Zydus Pharmaceuticals (USA) Inc.: It operates as Zydus’s main subsidiary in the United States, focusing on manufacturing and marketing generic formulations approved by the U.S. FDA. A significant contributor to Zydus’s international revenue, given the high demand for generics in the U.S. market.
Zydus Healthcare Ltd: It manages Zydus’s branded formulations business in India, catering to a wide range of therapeutic areas such as cardiovascular, gastrointestinal, pain management, and oncology. A major revenue driver for Zydus in the Indian domestic market.
Zydus Animal Health and Investments Ltd: It provides animal health products across livestock, poultry, and companion animals, including treatments, nutritional supplements, and anti-infectives. It expands Zydus’s reach into veterinary and animal health segments, which are growing markets in India and internationally.
Zydus Biosimilars Ltd: A dedicated unit for biosimilars, developing and commercializing biosimilars for therapeutic areas like oncology, immunology, and nephrology. Positions Zydus as a key player in biosimilars, targeting high-growth opportunities in biologics.
Simayla Pharmaceuticals (South Africa) Pty Ltd.: Operates in South Africa, focusing on providing affordable generic and branded pharmaceuticals across a range of therapeutic areas. Extends Zydus’s market presence in Africa, catering to regional healthcare needs with affordable solutions.
Q2 FY25 & Business Highlights
Revenue of ₹5237 crore in Q2 FY25 up by 19.27% YoY from ₹4369 crore in Q2 FY24.
EBITDA of ₹1461 crore in this quarter at a margin of 28% compared to 26% in Q2 FY24.
Profit of ₹920 crore in this quarter compared to a ₹803 crore profit in Q2 FY24.
India branded formulations business posted double-digit growth and outpaced the market growth both in the chronic and acute segments. Consumer Wellness business delivered robust double-digit growth aided by strong volume uptake.
The US formulations business continued its upward journey with robust YoY growth driven by volume expansion and new product launches. International markets business grew in double-digit on the back of strong performance across key markets.
Capex for this quarter has been done by internal accruals and cash from the company worth ₹302 crore, for acquisition and patents.
India Formulations launched 12 new products (incl. line extensions) with 4 first-in-India launches. In the consumer wellness segment, growth was largely driven by strong 8.4% volume growth.
In Biotech and Vaccine R&D the company has completed patient recruitment for Phase III clinical trials for one of the biosimilars and follow-up has been completed and completed Phase II clinical trials for Hepatitis E vaccine.
Forayed into animal free fermentation-based protein business by forming a JV with Perfect Day Inc. through acquisition of 50% stake in Sterling Biotech Ltd (SBL).
SWOT Analysis:
Strengths:
Strong presence in the domestic market
Broad and diverse product portfolio
Advanced research and development capabilities
Significant global market footprint
Weaknesses:
Heavy reliance on the U.S. market
High expenditure on R&D
Exposure to patent litigation risks
Opportunities:
Expansion into biosimilars and specialty drugs
Government initiatives like the PLI scheme
Growth potential in the healthcare and wellness sectors
Threats:
Challenges in regulatory compliance and security
Pricing pressures in the market
Increasing competition from domestic and global players